This tab is part of the Edit Graphic Options for Cen-se dialog and contains additional display options.
Dots
Auto Size
Enable this option to allow the program to determine the best dot size, based on the current size of the object and other factors.
Dot Size
This field displays the current size of dots in points; a point is 1/72 inches. To set a specific size for the dots, uncheck the Auto Dot Size option and enter a value between 0.0 and 10.0 for Dot Size.
Show All Dots
Enable this option to display dots for all events. If this option is unchecked, the system will use the value in Desired Dot Number.
Number
If Show All Dots is unchecked, the system will use this value to determine the number of dots to display in the plot.
Coloring
Color Scheme
Choose the desired color scheme for Cen-se dots.
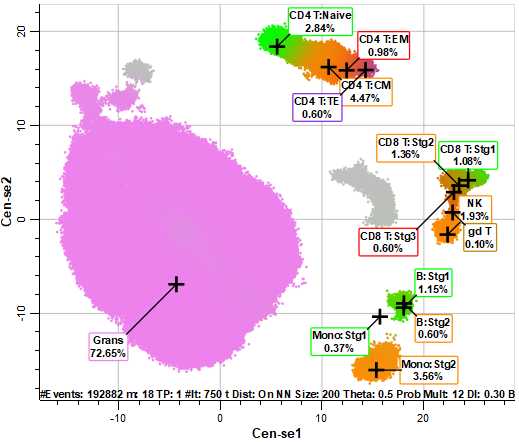
| Summary Map Colors | Colors are based on cell type
and staging colors.
|
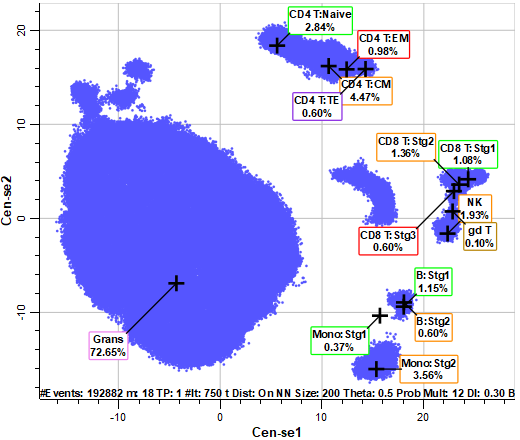
| Alternative Color | All events are drawn with the
Alternative Color selected.
|
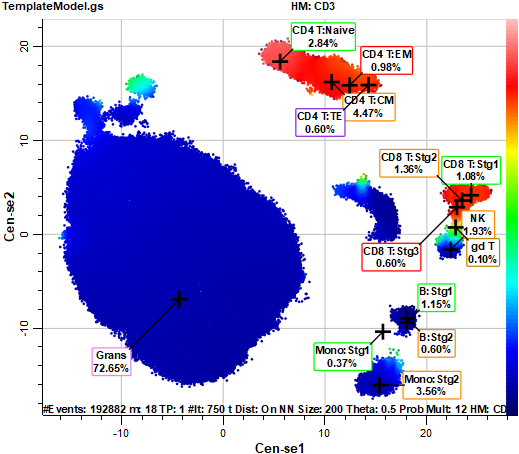
| Intensity Heatmap | Heatmap colors are based on intensity
of events for the selected measurement.
|
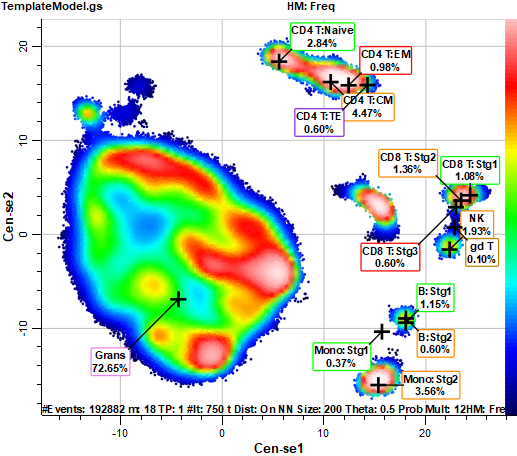
| Frequency Heatmap | Heatmap colors are based on frequency
of events.
|
| Cell Type Colors | Colors are based on cell type
colors.
|
Heatmap Measurement
Click to choose a measurement for the Intensity Heatmap.
Next Measurement
Selects the next measurement for Intensity Heatmap coloring.
Preceding Measurement
Selects the previous measurement for Intensity Heatmap coloring.
Alternative Color
This property defines the color used for Alternative Color coloring scheme.
Options
Population Selection Mode
If checked, only populations selected in the Summary Map are drawn.