
Any time you have a new panel to analyze with GemStone, you will create a new Project to setup the analysis for the panel. This tutorial shows how to create a new Project from scratch with a model template, a report, and a database of results. You will also set up batch options that define how each FCS file is read and analyzed.
That sounds like a lot of work, but you will leverage wizards and a streamlined interface to make quick work of it.
Start Gemstone by following the instructions in the Installation and Setup of GemStone section.
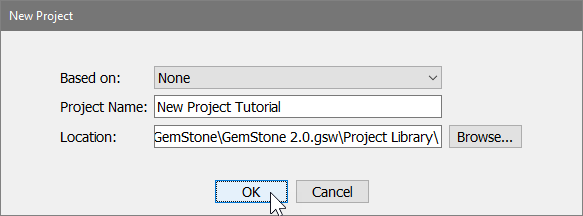
On the Home tab, click the New Project button to create a new Project.
In the New Project dialog, type "New Project Tutorial" for the name, and then click OK.
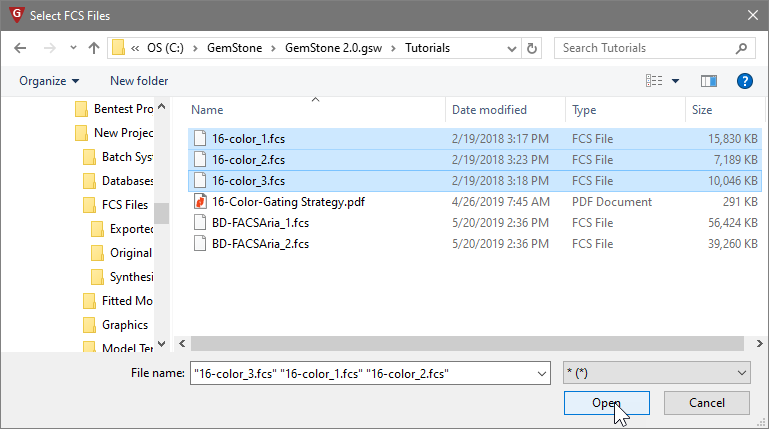
Next, you will add files to analyze. Click the Add FCS Files button on the Home tab.

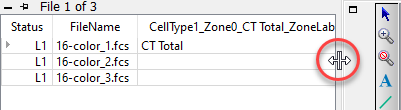
In the Select FCS Files dialog, navigate to the Tutorials folder of the GemStone workspace. Select the three files 16-color_1.fcs, 16-color_2.fcs, and 16-color_3.fcs. Click Open.
The files are added to the batch list in the left panel of the program.
When you read files that are new to the program, it's a good idea to read one in and review the measurement names and transforms. You can edit the names and transforms with the Measurement Wizard.
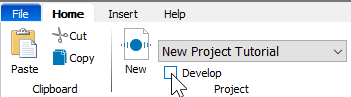
Click the Develop checkbox to enable "Develop mode". This mode exposes additional tools that are used to build the Project.
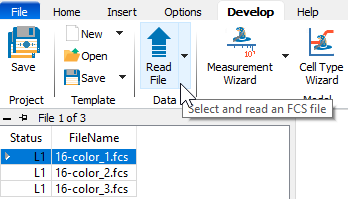
On the Develop tab, select the first file in the list and click the Read File button. This command will read the selected FCS file without performing any analysis.
Now click the Measurement Wizard button. This wizard is used to set up the names and transformations for the measurements in the FCS files.

Click the All button to select all of the measurements in the FCS file.
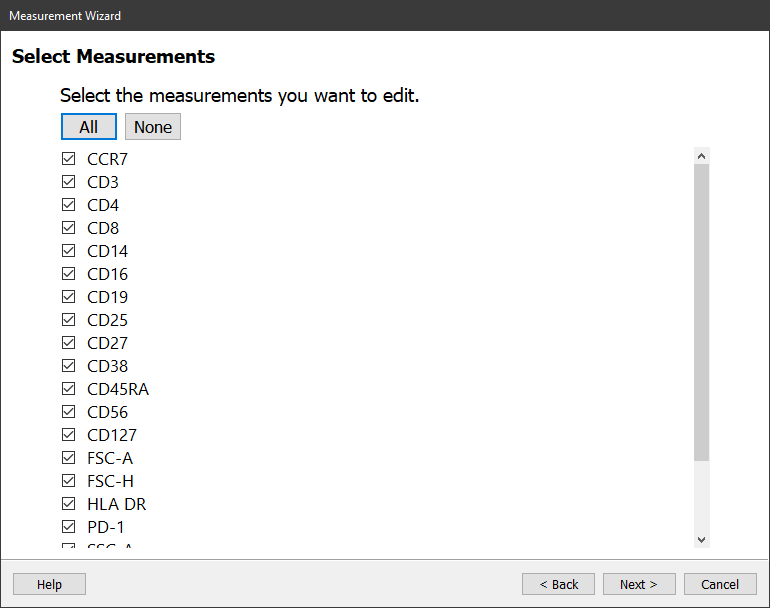
Click Next.
The properties for CCR7 are listed, and a histogram of the measurement provides a preview of the measurement with the properties applied to it.
In this dialog, you can edit the measurement name and abbreviation. By default, these will display the long name from the FCS file's keywords. You can also edit the transform and its properties.
No changes are needed for CCR7.
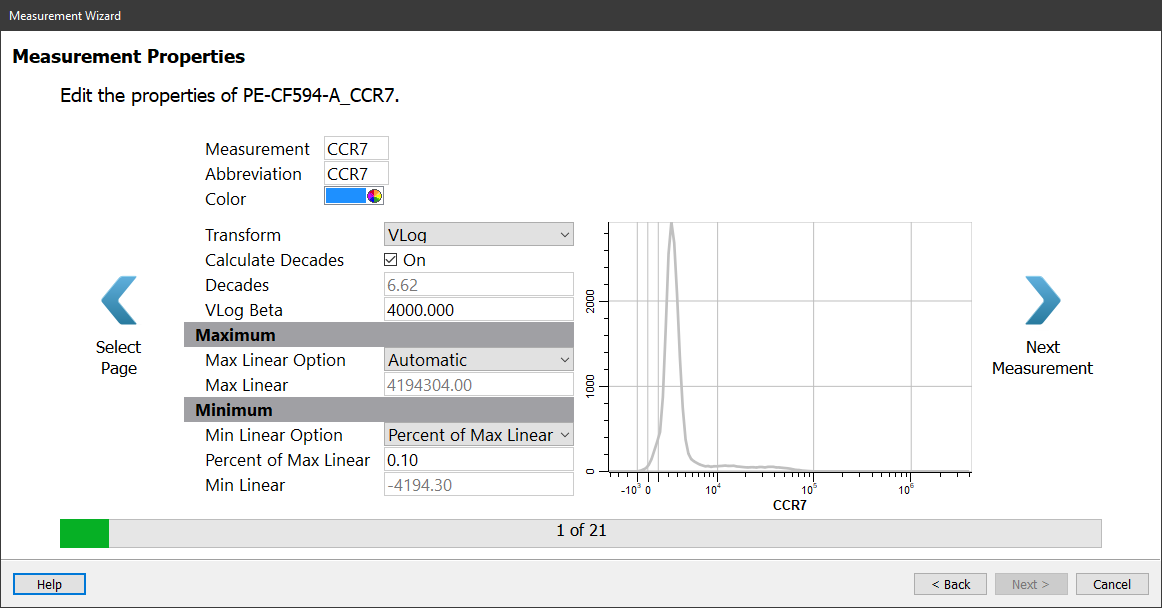
Click the Next Measurement button.
Review each of the remaining measurements in the same manner. There is only one change you will need to make.
When you reach the Time measurement, set the Transform to Linear.
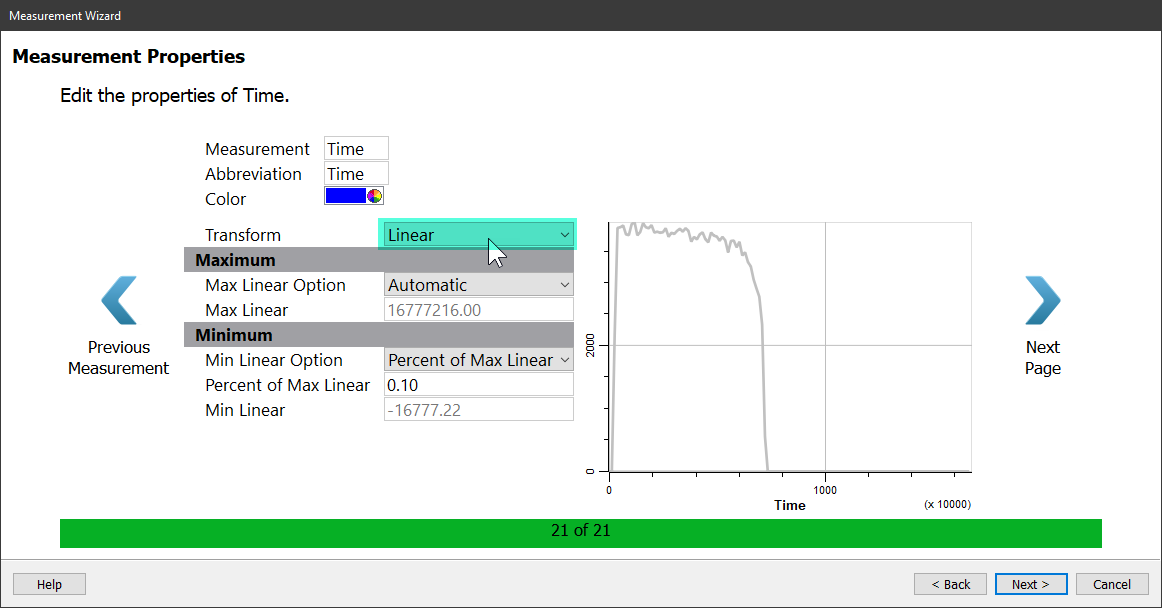
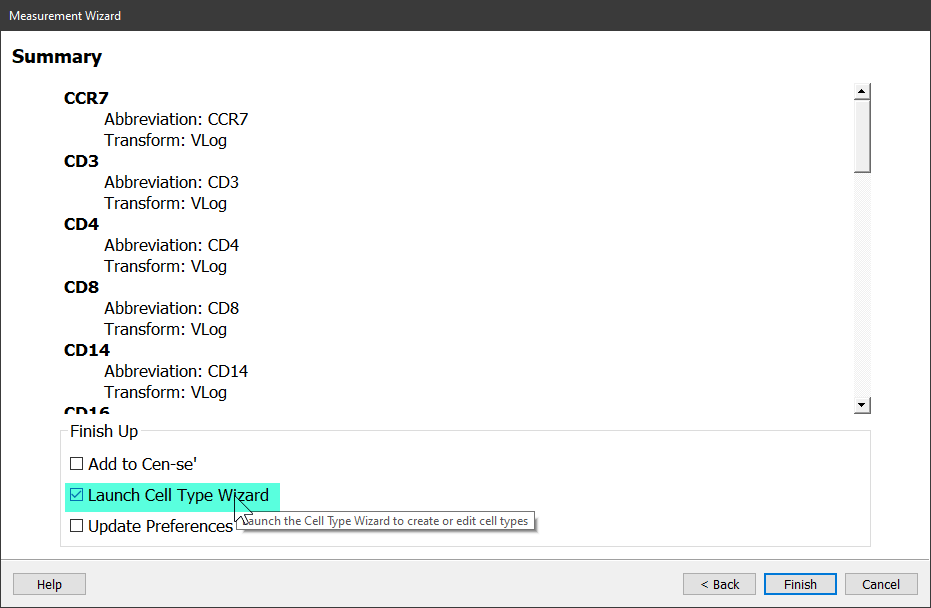
After setting the Time measurement, click Next and the Summary page is displayed.
Enable the Launch Cell Type Wizard checkbox and then click Finish.
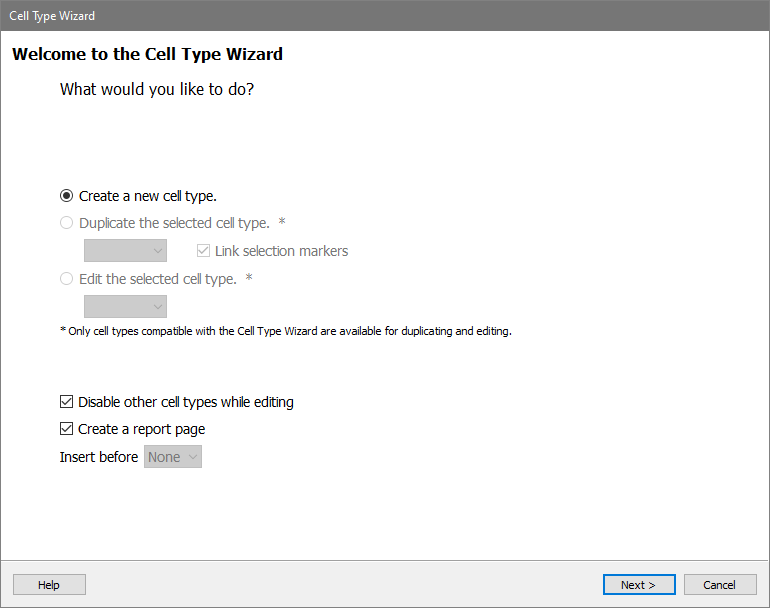
Now that the program knows about the measurements and transforms, let's start building the analysis using the Cell Type Wizard. This wizard creates or edits the analysis of one cell type at a time, one measurement at a time. You will use it to create just about everything for analyzing this 16-color example.
If the wizard is not already showing, click the Cell Type Wizard button on the Develop tab.

On the Welcome page, choose Create a new cell type and click Next.
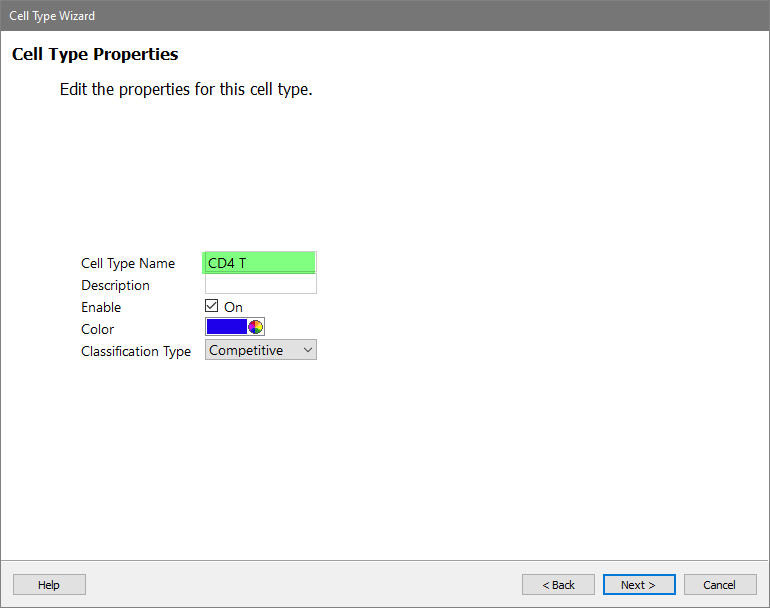
On this page, you will give the cell type a name.
Type "CD4 T" for the Cell Type Name.
This page also lets us enable the cell type, pick a color for it, and determine the classification type. For this tutorial, leave these options as they appear and click Next.
Next choose the measurements that are used to identify the CD4 T cells. These are called Selection Markers. These can be "positive" markers, as well as markers that are "negative" for the cell type. In this tutorial, you'll just choose several markers that are positive for CD4 T cells.
In the Available Markers list, click each of these markers in this order: SSC-A, CD3, CD4, and CD8
The markers will be removed from the Available Markers list and added to the Selection Markers list.
If the markers are not in the correct order, you can drag the markers in the Selection Markers list to reorder them.
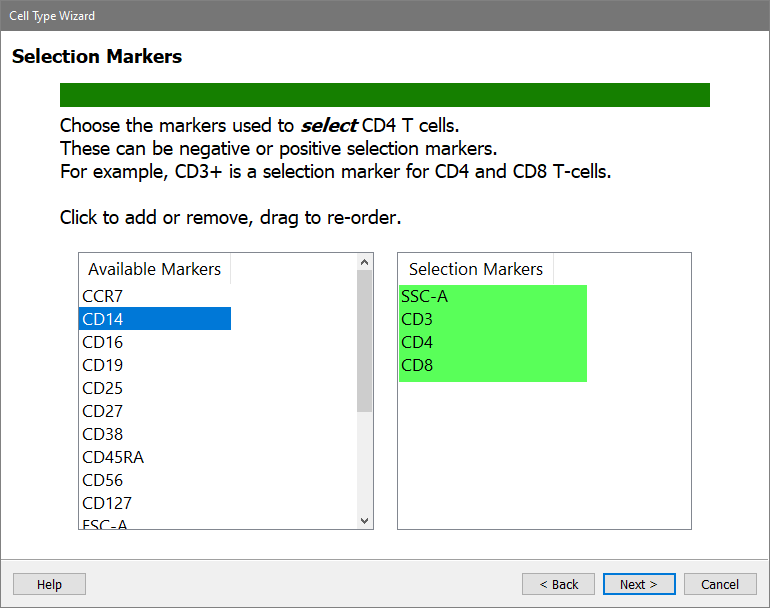
Click Next.
On the next page of the wizard, choose the Staging Markers for the CD4 T cells. These are markers that change expression levels within the cell type. They are used to identify different stages of CD4 T cells.
In the Available Markers list, click each of these markers in this order: CCR7, CD45RA, and CD27
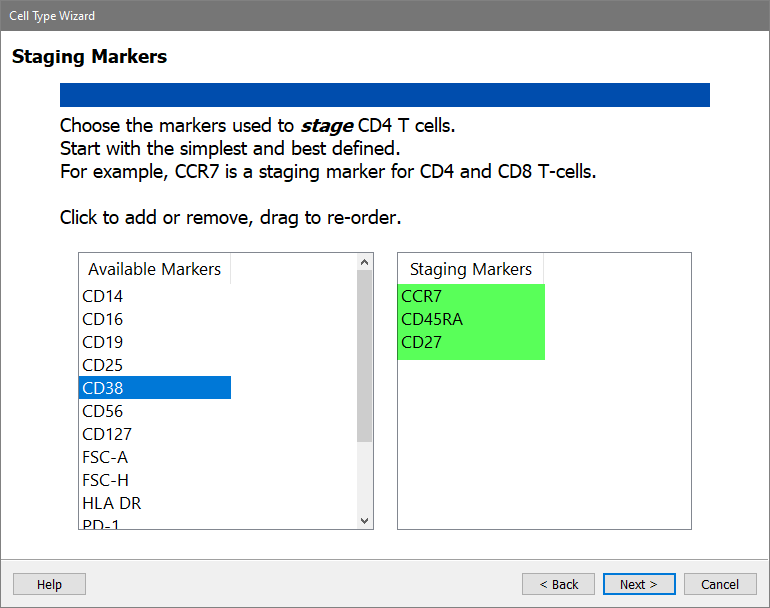
Click Next.
Next is the Functional and Other Markers page of the wizard. This is where you can pick other markers that you want to see in the CD4 T cell type, even if they are not used for selection or staging of the cells. Activation markers are a good example of what you would pick on this page.
In the Available Markers list, click each of these markers in this order: CD25, CD127, and HLA DR
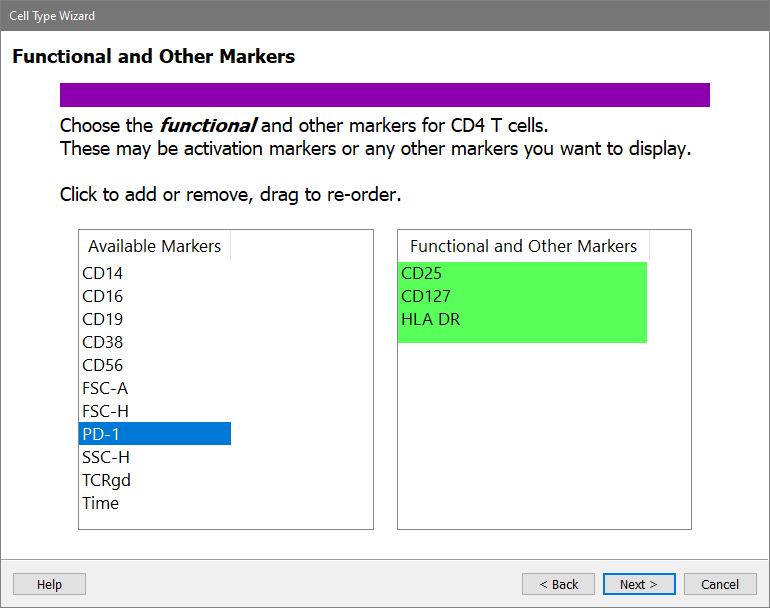
Click Next.
Now that you have identified the markers to use for the CD4 T cells, the next task is to set up expression profiles for them.
GemStone uses expression profiles (EPs) instead of gates used in most cytometry analysis software. EPs come in different shapes, like constant, step-up, and step-down. They define a probability envelope, which does not have hard edges.
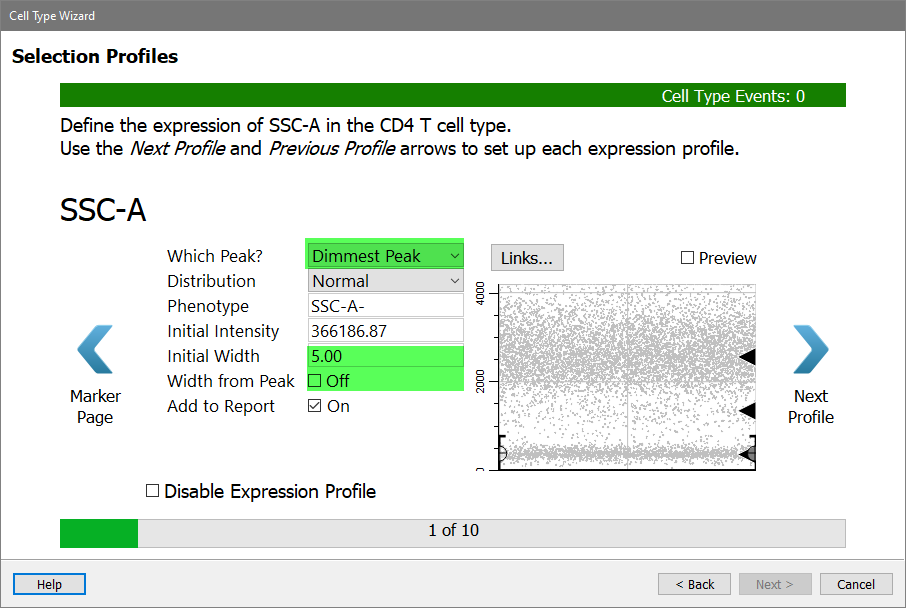
The wizard is showing the first Selection marker, SSC-A, with several properties and an unusual dot plot that may not make immediate sense to you.
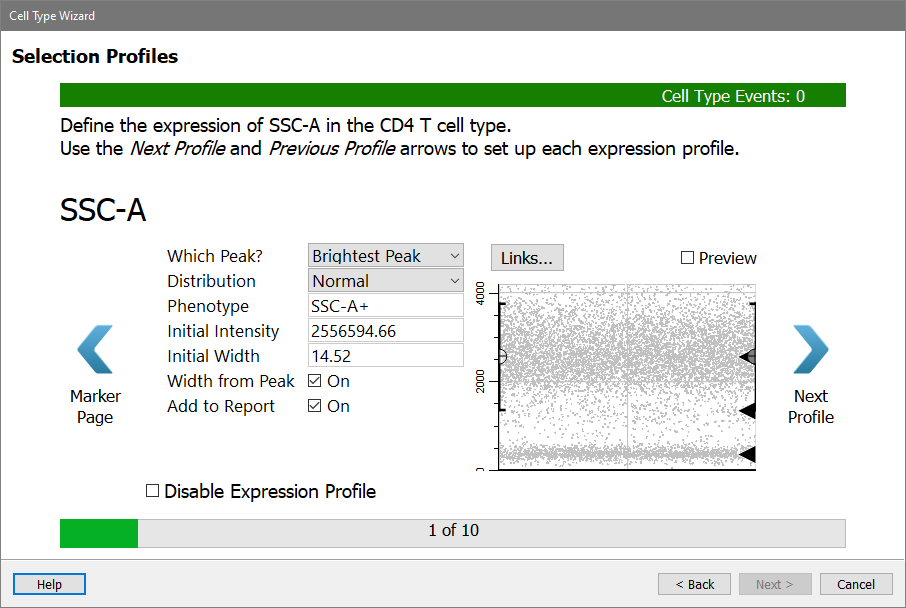
Here's how to interpret the plot. Think of a typical histogram of SSC, as in panel A below. Now rotate that histogram 90 degrees (panel B). Now notice that the density of dots in panel C matches the peaks in panel B. The Y-axis of the dot plot is SSC-A, and the X-axis (at this point) is the order of the events in the FCS file. There are black triangles on the right edge to indicate locations where the program found a peak in the data.
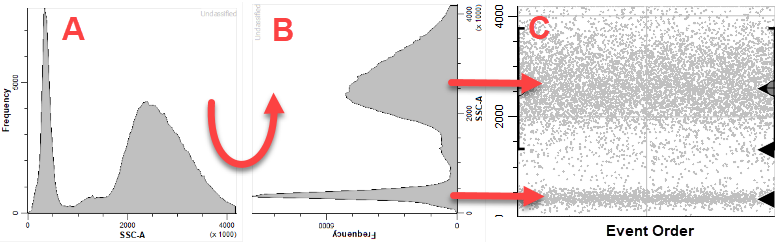
The CD4 T cells have low SSC-A, and you can see a black triangle that identifies the dimmest peak of the SSC-A distribution. That's the one you want to capture with this expression profile.
Choose Dimmest Peak for Which Peak.
There are several options for the Distribution. Leave the Distribution set to Normal.
The Phenotype is automatically updated as you make choices. It should show "SSC-A-" at this point.
The Initial Intensity is currently set to the location of the peak that you linked the profile to. You do not need to change that.
The Initial Width is set to the width (SD) of the peak that was found. You don't want this expression profile to be quite that restrictive, so you'll make two changes.
Set Initial Width to 5 and uncheck Width from Peak. This will leave the width at an SD of 5 and maintain a generous width for SSC-A.
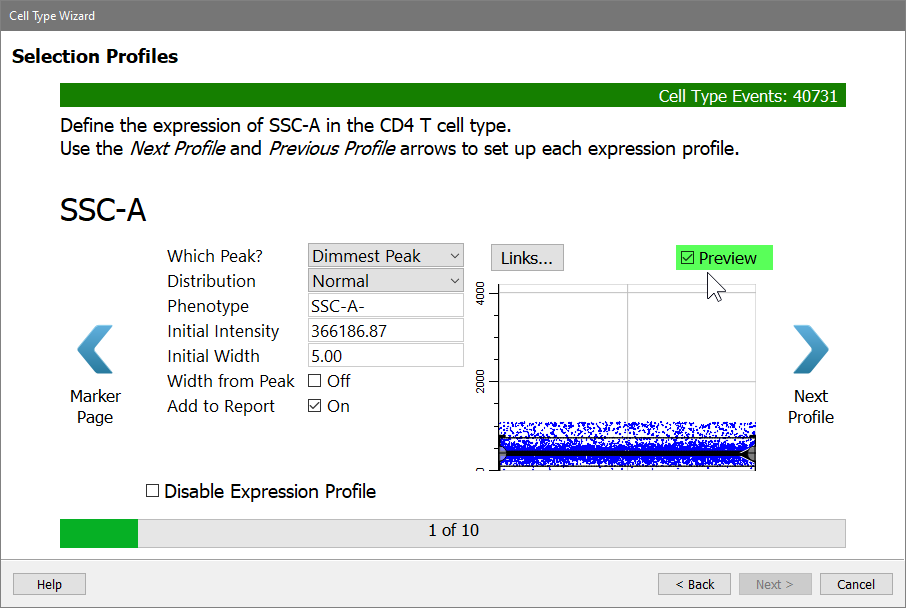
Click the Preview checkbox on the right of the dialog to see what cells will be selected by this profile.
Click Next Profile.
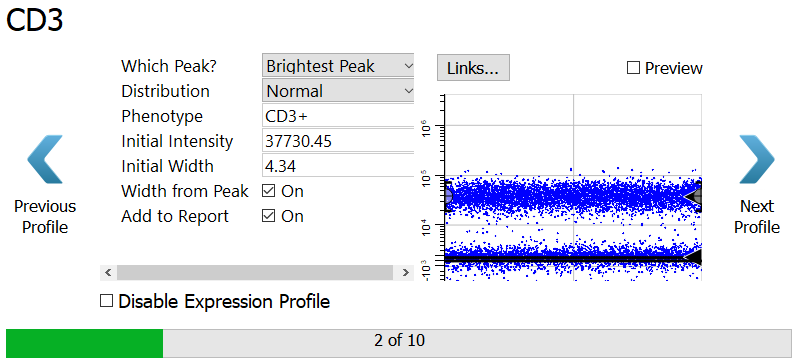
CD3 is next. We want the program to find the brightest CD3 peak, and it is already setup that way.
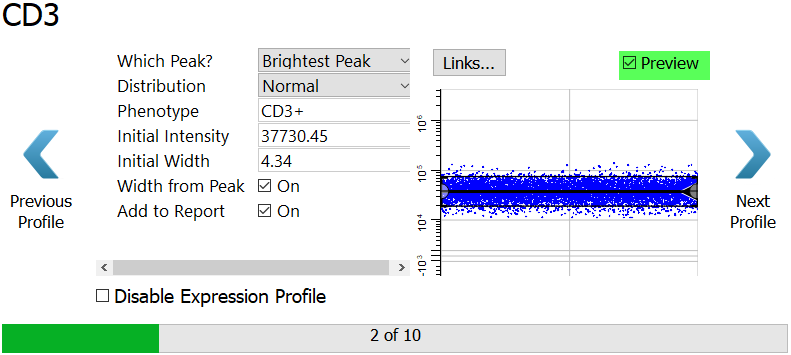
Click the Preview checkbox on the right of the dialog to see what cells will be selected by this profile.
Click Next Profile.
CD4 is set up in the same way, tracking the brightest peak. You don't have to make any changes to this profile.
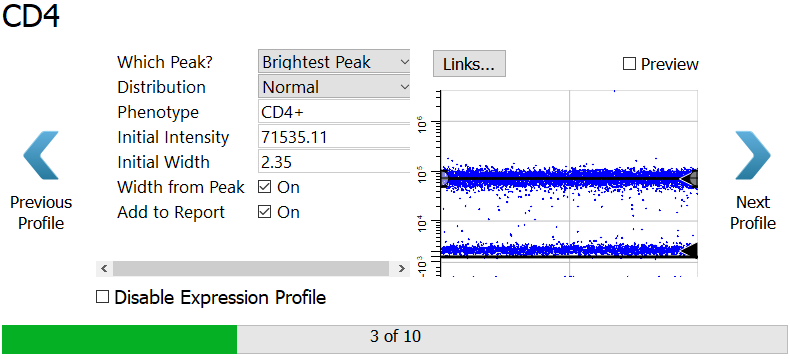
Click Next Profile.
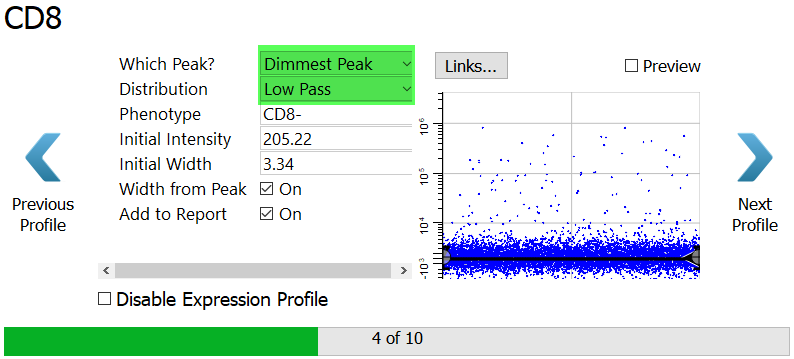
For CD8, choose Dimmest Peak.
For the Distribution, select Low Pass. A low pass distribution includes the events below the top of the expression profile. This will capture all of the CD8 negative events.
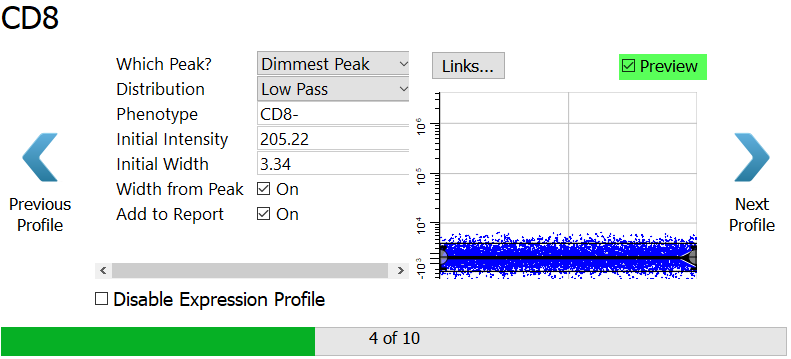
Click Preview to see the events that are selected.
Click Next Profile.
Now that you have set up the expression profiles for the selection markers, you are ready for the staging markers. For these, you will use profiles that have two or more levels of expression.
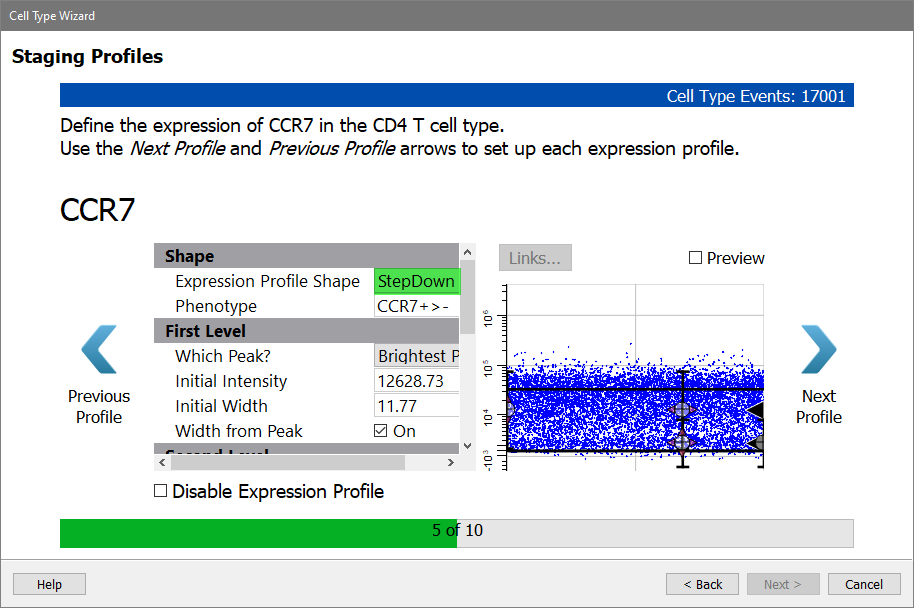
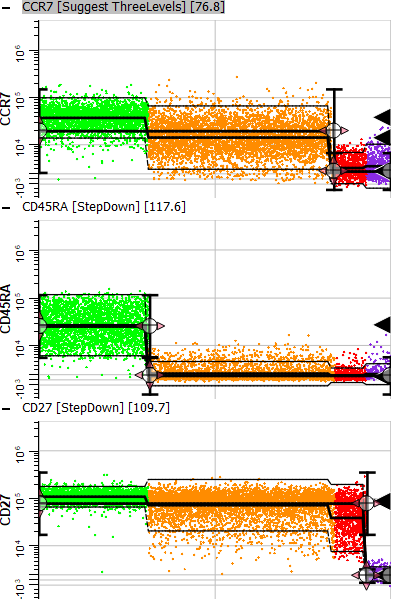
CCR7 is expressed on naive CD4 T cells, and it is down-regulated as the cells mature. The StepDown profile is designed for this type of expression.
NOTE: Depending on your monitor, you may need to resize this dialog to see the options in the property list.
For Expression Profile Shape, choose StepDown.
The other settings will update so that the First Level of the profile tracks the Brightest Peak and the Second Level tracks the Dimmest Peak.
Enable the Preview checkbox to see the StepDown profile results. Note that the dots representing the cells have been reordered so that the brighter CCR7 events are first and the dimmer ones are at the end. As soon as you enable a staging profile like this, the X-axis is no longer showing the order of events in the FCS file. Now, the X-axis is showing the progression of events, and this order is also enforced in the selection marker plots that you setup previously.
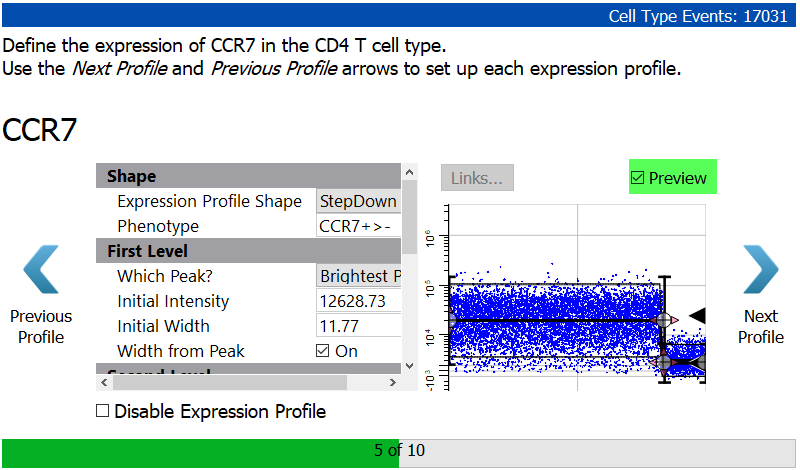
Click Next Profile.
You will setup CD45RA in a similar way with a StepDown profile.
Select StepDown for the Expression Profile Shape.
Because there is so much variability in the brighter level of CD45RA, you will set the Initial Width to 10 and uncheck the Width from Peak setting.
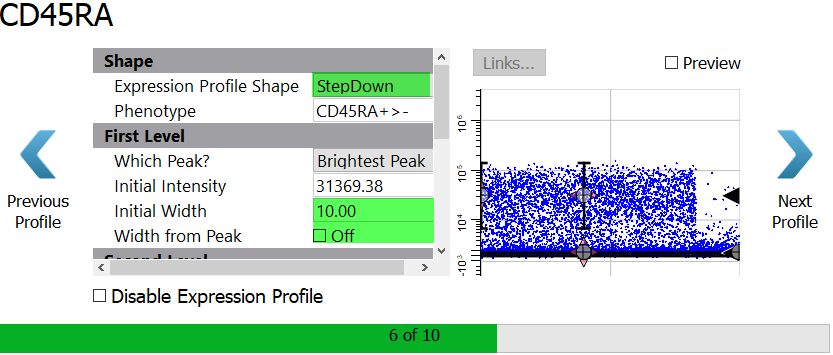
Enable the Preview checkbox to see the StepDown profile results.
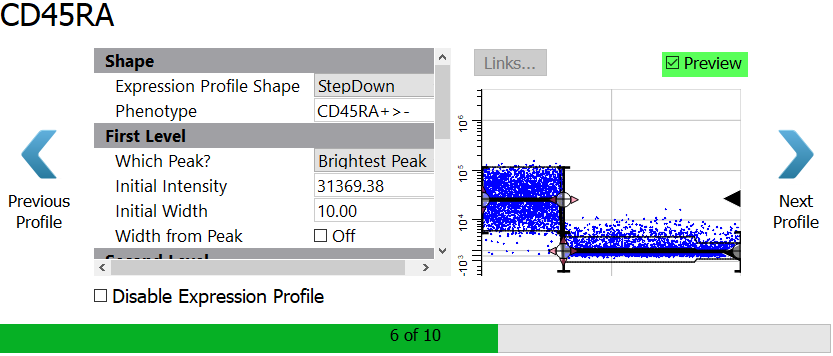
Click Next Profile.
The program thinks there are three levels of expression for CD27, and this may in fact be the case. However, unless the levels are very clearly shown, it generally works better to use two levels for these distributions with wide variation.
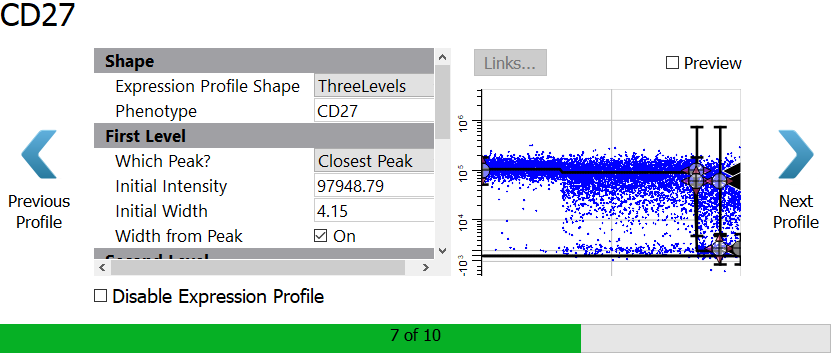
Select StepDown for the Expression Profile Shape.
Set the Initial Width to 10 and uncheck the Width from Peak setting.
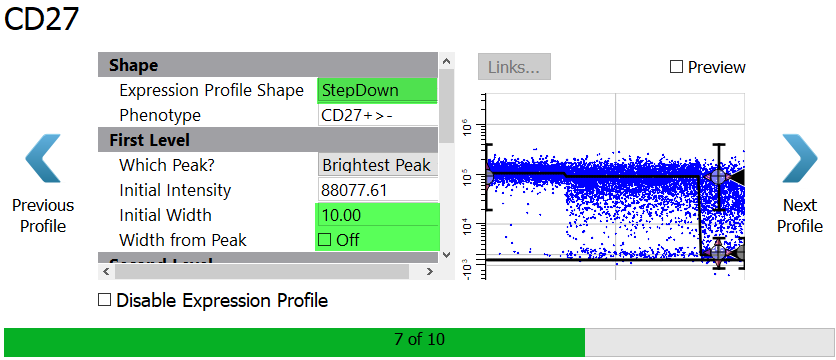
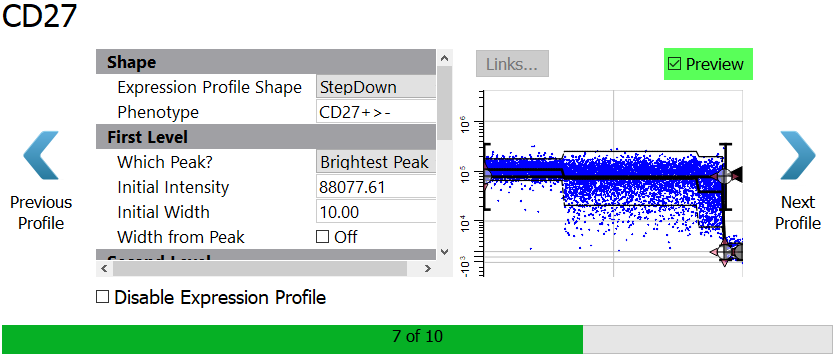
Enable the Preview checkbox to see the StepDown profile results.
Click Next Profile.
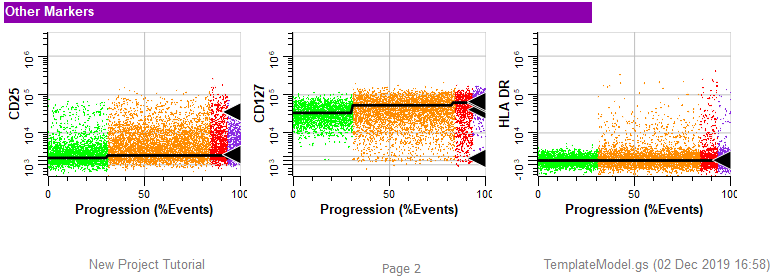
Next come the functional makers. For now, skip over these without setting up a profile.
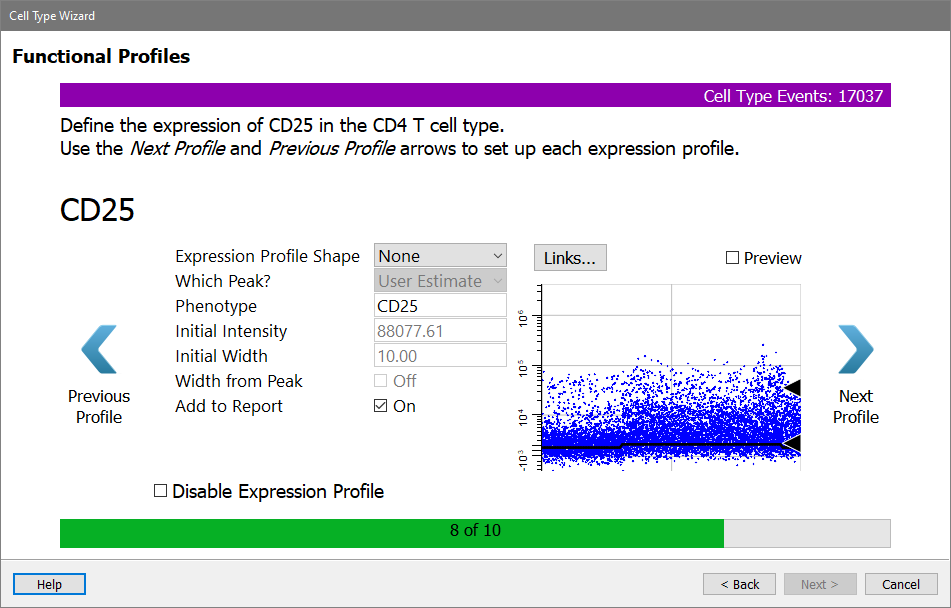
Click Next Profile for CD25.
The CD127 profile is shown.
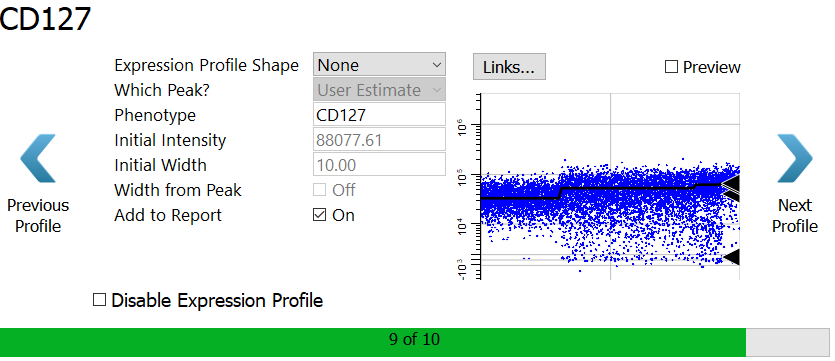
Click Next Profile for CD127.
The HLA DR profile is shown.
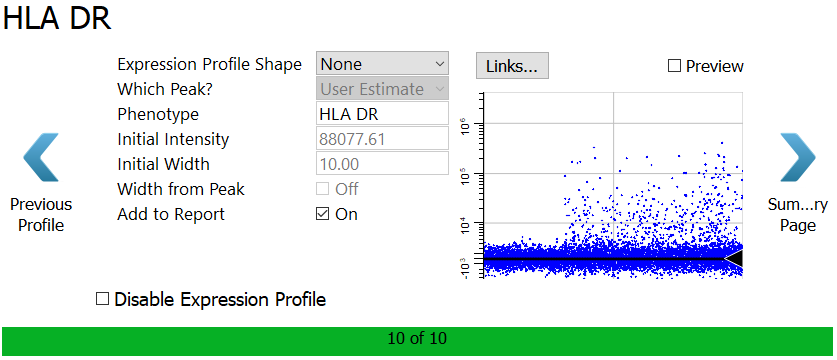
Click the Summary Page button.
A Summary page is shown, allowing you to review the choices made in the wizard.
Make sure all the checkboxes are enabled, except for Do another cell type.
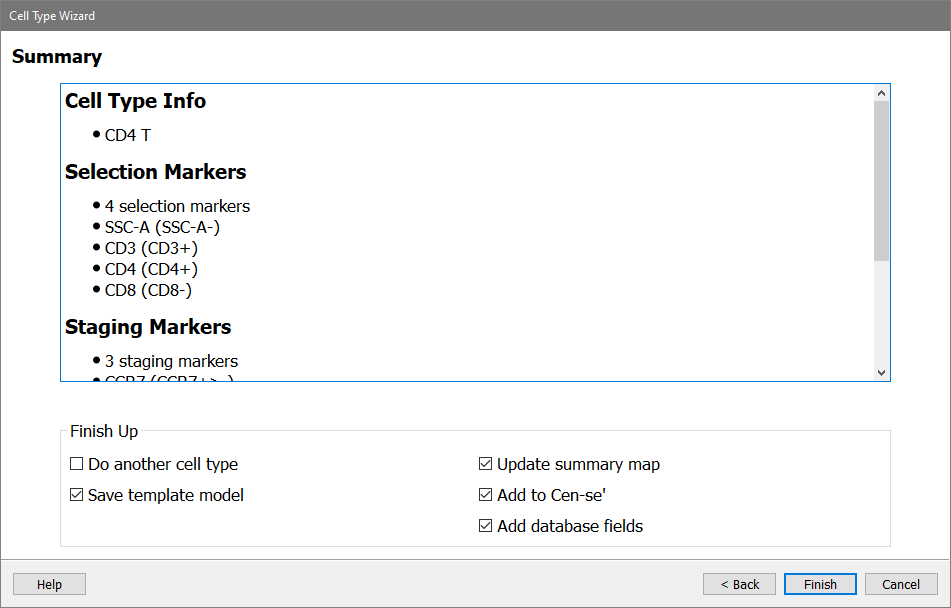
Click Finish.
Congratulations! You've just created the CD4 T cell type analysis, complete with a report page. Your work was saved as a "template model" which can be applied to any FCS files that have the same markers and marker names.
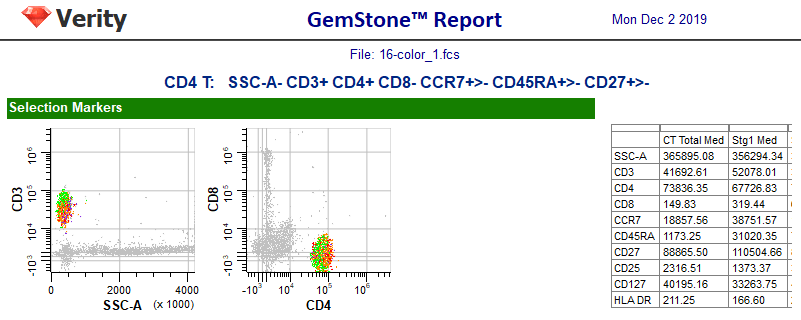
The wizard created a report page based on the choices you made for each marker. The page includes the current date, the name of the FCS file, and the cell type name and phenotype at the top.
Next, there is a section for the selection markers. Each marker is included in at least one dot plot. These plots can be changed to show different marker combinations, and you can add other plots as well with the tools on the Insert tab.
On the right is a table listing all of the markers you included in the cell type. For each marker, the table shows the median intensity for the whole cell type as well as for each stage. You would need to resize the table to see all of the columns, but leave that for later.
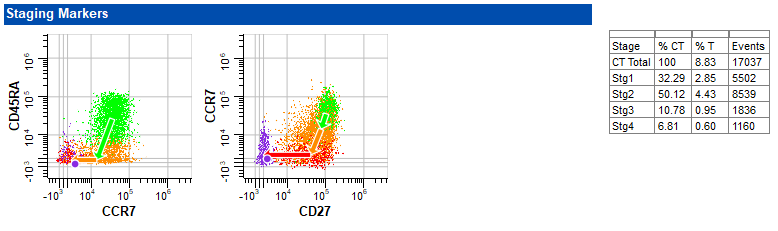
The next section in the report shows the staging markers. A table summarizing the percentages and number of events in each stage appears on the right. The wizard automatically determined the four stages of CD4 T cells based on when markers changed expression levels.
Finally, the other markers are shown, each with an expression profile plot. The footer of the report page shows the name of the Project, the page number, and the template model that was used for the analysis.
The report is well organized and shows the important information from the analysis. However, it is not showing the expression profiles that were set up in the Cell Type wizard. For that you need to switch to a different tab.
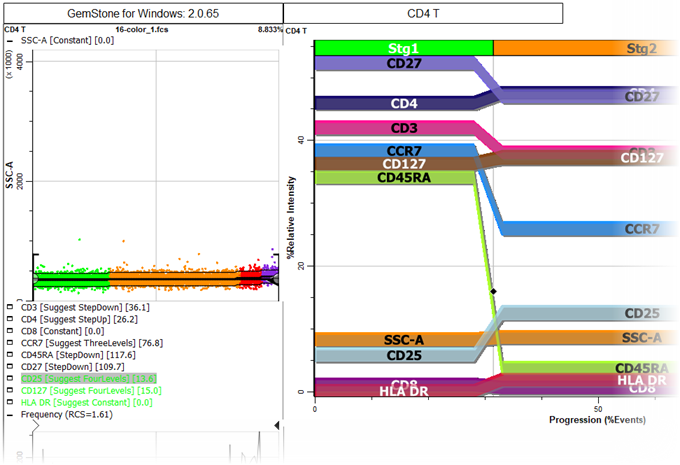
At the bottom of the program window, click the Cell Types tab. The program switches from showing the report pages to showing the cell type definitions.
On the left of the CD4 T cell type tab is a stack of expression profiles. These are the same profile plots that were created in the wizard. There is also an Overlay Plot, which shows all of the markers and stages on a single plot. This is a great plot for seeing how markers up- and down-regulate in a coordinated manner.
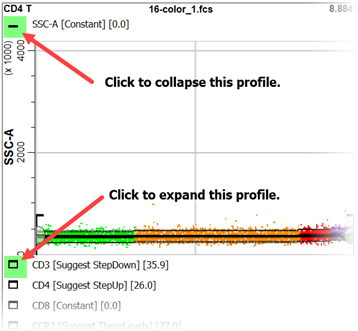
The icon next to the title of each expression profile is used to expand or collapse the profile.
If you scroll down in the cell type window, you'll find the three staging markers that were set up with StepDown profiles. You can see that the first stage (green dots) ends when CD45RA has down-regulated. Stage two (orange) ends after CCR7 down-regulates. Stage three (red) ends after CD27 down-regulates, and stage four (purple) contains the events that have down-regulated for all three markers.
Now that you have the beginnings of an analysis approach, let's see how to set it up for automation.
You may need to resize the section to see the properties listed. You can also change the width of the batch list by adjusting the right edge as shown below.
The lower left portion of the screen contains the settings that control batch processing.
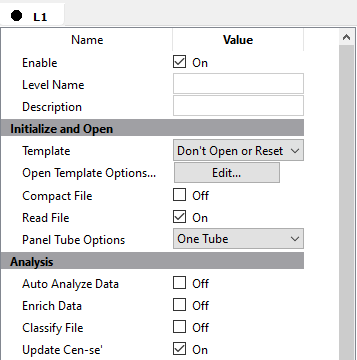
The first thing the batch should do when analyzing a file is to open the template model that you just created with the wizard.
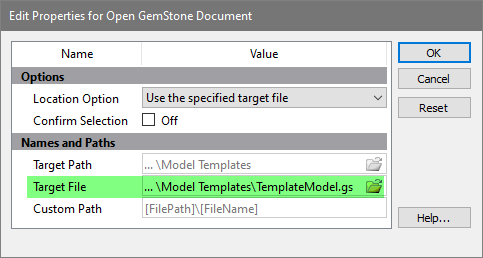
Choose Open for the Template property.
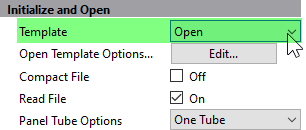
Next click the Edit... button for Open Template Options.
In the dialog that appears, make sure that Target File is set to TemplateModel.gs. If not, click the folder icon and select the template model to use.
Click OK.
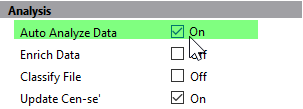
In the Analysis section, enable Auto Analyze Data. This tells the program to auto analyze the FCS file with the template model.
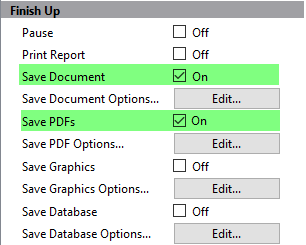
Once the analysis is complete, the Finish Up section determines what kinds of output to generate.
Enable the Save Document and Save PDFs properties.
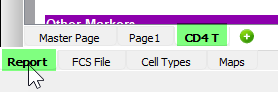
Now you're ready to save these changes. Before you do, let's make sure that the template model is showing the Report tab and the CD4 T report page. This will be the view you see when the analysis completes.
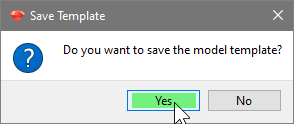
Click the Save Project button in the upper left of the Develop tab of the ribbon bar.

When prompted to save the model template, click Yes.
You now have created the model and defined the batch process.
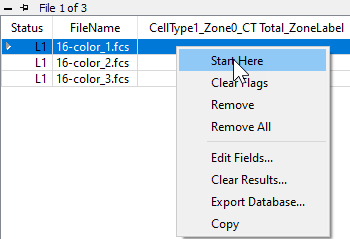
Let's see if everything works as expected.
Right-click the first file in the batch list and choose Start Here from the context menu.
On the Home tab, click the Auto Advance button. This tells the program to analyze all of the files in the batch without intervention.
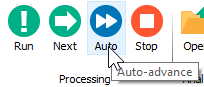
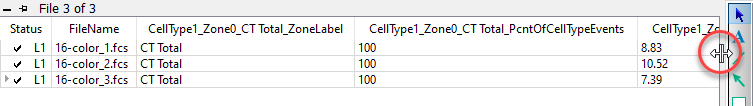
Our template model is pretty simple at this point, so the analysis will be quick. Once it has completed, you can review the results by scrolling horizontally in the batch list.
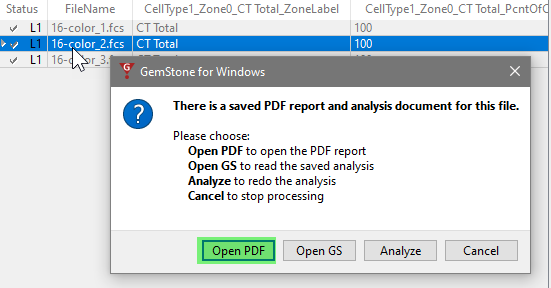
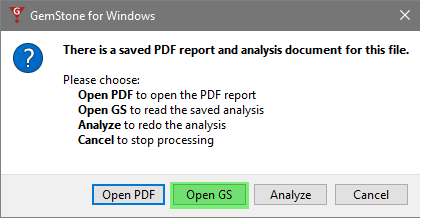
If you want to review one of the analyzed files, double-click the file in the list. The program will ask what you want to do: open the PDF, open the saved analysis (Open GS), redo the analysis (Analyze), or cancel the dialog.
Choose Open PDF to view the report in PDF format. Note, at this point the first page in the report will be blank. We will use this blank page as a summary page in later tutorials.
Double-click the file again, and this time choose Open GS. This will open the finished analysis of the file. With this, you can make manual changes and review the details of each cell type. This is especially useful when creating new template models or trying to determine the cause of a problem.
In this tutorial you started a new project from scratch. You gave friendly names to the measurements and used the Cell Type wizard to create one cell type for CD4 T cells. In the process, you looked at the different ways to setup expression profiles and a few caveats. The wizard created a template model from our choices and a report page with plots and tables of statistics.
You learned how to set up the batch options to process a set of files through the template model, and then you tested it out by analyzing all of the files added to the project.
One thing to keep in mind is that you will not always have to start from scratch. You can reuse the template model for other files that were acquired with the same panel. If you extend that panel with additional markers, you can create a new Project based on this one so that you only need to define the new portions of the analysis.
The tutorials that follow will build upon what you have created in this one.