
Research
and Compliance Mode note:
In RUO mode, all users can perform these tasks.
In Compliance mode, only ModFitAdmins
have permission to perform them.
This dialog is used to set program configuration options.
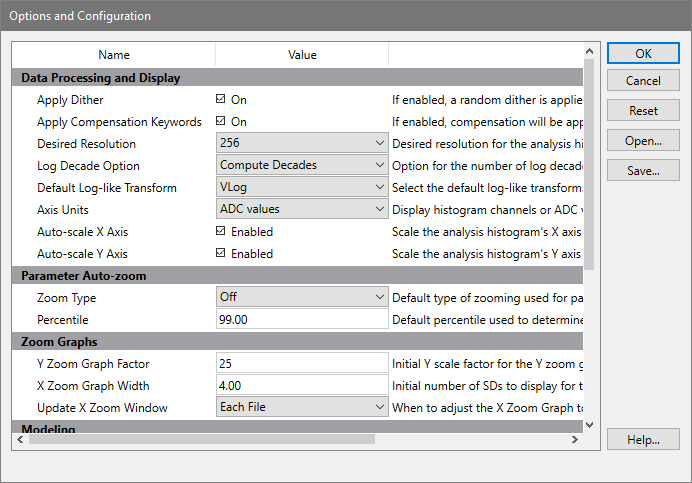
Data Processing and Display
Apply Dither
When enabled, a small random value is added to listmode events to make the distributions continuous. This is enabled by default.
Apply Compensation Keywords
When enabled, the program will read compensation keywords from the FCS file and apply compensation defined in those keywords.
Desired resolution
Select the desired resolution for the analysis histogram. It is strongly recommended that you use the default setting of 256 channels to improve performance and consistency. The histogram will be displayed and analyzed at the desired resolution, provided that the parameter's resolution is greater than or equal to the desired resolution.
Log Decade Option
This option determines how many decades will be displayed for listmode data. Choose between "Computed Decades" and "Force Four Decades". Computed decades are based on the ADC resolutions stored in the FCS file keywords.
Default Log-like Transform
Choose the transform to use for log distributed data, by default. Options include Log, HyperLog, Hyperbolic Sine, and VLog.
Axis Units
Choose between "Histogram channels" and "Data (ADC) values". Historically and by default, ModFit displayed the axis with histogram channel tic marks, and results were reported on that scale. To display the axis with the true resolution of the FCS data, choose "Data (ADC) values"; this will also change results to be on the ADC scale.
Auto-scale X axis
Auto-scale Y axis
These options control the auto-scaling of the main histogram graphic. When checked, each data file is automatically scaled on the X-axis and/or Y-axis as it is opened. The Y scaling is set to the height of the highest peak. The low X scale is set to 0. The high X scale is set to the highest channel that contains data, to a maximum of resolution minus 1.
Uncheck one or both of these options to leave the scaling unchanged as new data files are opened. This is convenient for studies where it is useful to see all histograms on a fixed scale.
Parameter Auto-zoom
Zoom Type
Choose how this parameter should be zoomed when ModFit reads it.
Off: no zooming is performed.
To highest used channel: zooms to the highest channel that has events in it.
To fixed upper boundary: zooms to the channel defined in the Fixed Upper Boundary edit box below.
To Percentile: zooms to a percentile location in the data.
Percentile
This field is used when To Percentile is selected for Zoom Type. It defines the percentile of data to include in the zoomed area.
Zoom Graphs
These settings determine the default values for X and Y Zoom graph objects. These objects can be placed on the report to show the histogram zoomed in the X or Y scale, respectively.
Y Zoom Graph Factor
Enter the initial value for Y Zoom graph objects. The value is the number of times to magnify the scale, e.g. 25 means multiply data points on the Y scale by 25.
X Zoom Graph Width
Enter the initial width as a number of standard deviations to display in the X Zoom graph object.
Update X Zoom Window
The X Zoom window object on the report can adjust to the position of peaks in each file, or only when created. Select the appropriate option.
Modeling
Dip G2M Fraction
This value is used to compute the relative area of the Diploid G2M in Tetraploid models. Because the Diploid G2M in a Tetraploid model is in the same location as the Tetraploid G1 peak, the program disables modeling of the Diploid G2M. After the model fit is completed, the program adjusts the Tetraploid G1 by subtracting a portion of its area and assigning it to the Diploid G2M. The adjustment is computed by multiplying the Diploid G1 area by the Dip G2M Fraction. The default value is 0.08, or 8%, which means that the Diploid G2M area will be 8% of the Diploid G1, and the Tetraploid G1 will be reduced by the same area.
Display nRCS
This option enables the display of the "Normalized Reduced Chi
Square", or nRCS, on the report. The nRCS is an RCS value computed
on files with > Target Area for nRCS
events.
When RCS is computed on files with a large number of events, it increases
simply due to the additional events. This makes it difficult to
determine whether the fit is good or bad. The nRCS addresses this
by scaling the data to the Target Area
for nRCS events and then computing RCS on that. The result
is a value which behaves well even with large event counts.
Target Area for nRCS
This value determines the number of events to use for the nRCS calculation. See the discussion of nRCS above.
AutoLinearity
These settings control the AutoLinearity function of the program. This feature is available when batch processing reports, and in the Quick Model Editor. See Using AutoLinearity for more on this feature.
Low linearity
This field sets the lowest value used by the AutoLinearity operation. Values for this field must be between 1.85 and 1.94, inclusive.
High linearity
This field sets the highest value used by the AutoLinearity operation. Values for this field must be between 1.95 and 2.2, inclusive.
Miscellaneous
Copy/Save DPI
This option controls the quality of the graphics copied to the clipboard and saved to files by the program. DPI stands for dots per inch, with larger values providing higher quality images and larger file sizes.
Default Graphic output
Choose the desired graphic format to create when exporting histogram and report graphics. Export commands are found in the File menu and in the File and Report Batch Settings dialog.
Supported formats currently include bitmap (bmp), JPeg (jpg), Tiff (tif), Portable Network Graphics (png), and Scalable Vector Graphics (svg).
PDF Output Quality
This option controls the quality of the PDF files created by the program. Generally, higher quality PDF files are larger than lower quality files.
Parameter Database
ModFit LT keeps track of which parameters from the FCS file you have used for gating and analysis. This command allows you to view and edit settings for these parameters, including whether they are linear or log. See Edit Parameter Database for more information.
Save Recovery Backup
ModFit can save your work periodically so that if there is a problem you can recover. Choose the time interval for automatic backups.
Status Bar Text
The field determines what will be displayed on the status bar. By default, it is set to "Project: [MF_PROJECT_NAME]", which displays the word Project: followed by the name of the current project. Any of ModFit's keywords can be used in this field, surrounded by square brackets, and the resulting expression will appear on the status bar.
Startup Action
This option determines what happens when ModFit LT is opened. By default, it will Open the last project. Other options include Don't open or create a project, Open a project, and Create a new project.
Copy Data into Project
This preference determines the default state for the "Copy Data Files" option in the New Project dialog. Enable this option if files should typically be copied into the project folder. Disable the option if files should typically not be copied into a project folder.
Open
If you have previously saved configuration settings to disk, you can use the Open button to load those settings into the program.
Save
Use this option if you want to store the current configuration settings to a file on disk. The standard file save dialog box will be displayed, allowing you to navigate to a location and name the file to save.
Reset
Click this button to restore the configuration values to the factory default settings.
OK
Click this button to accept the changes you have made and close the dialog.
Cancel
This option closes the dialog and discards any changes you might have made.
Help
This option displays the on-line help for this dialog.