This tutorial introduces the use of the Cell Tracking Wizard, used to analyze samples stained with cell tracking dyes.
You will learn how to start the Cell Tracking Wizard, how to adjust the settings used to create the model, and how to analyze your data samples with the model created. The primary job is to identify the location of the parent population and confirm a few other settings. Once these simple decisions are made, the Wizard constructs a model that easily analyzes your cell tracking samples.
Starting the wizard
The files you will use in this tutorial are stored in a folder called "Proliferation" in the Samples folder under the ModFit LT program folder.
Setting up the model
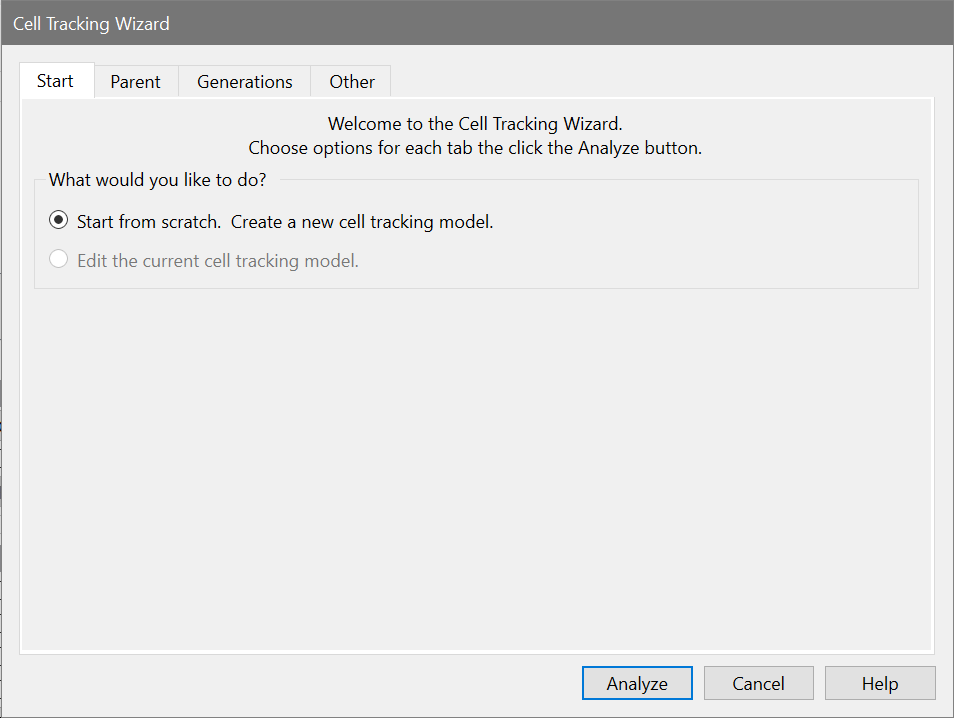
The tabs across the top of the dialog are labeled with the categories you can adjust in the model.
The options on the Start tab let you create or edit a model, and also provide an alternate path to open a data file. Since you have already opened the file we want to use and are ready to create a model, you do not need to make any changes to the Start tab.
This tab displays your data file so that you can tell the Cell Tracking Wizard where the Parent population peak is. The program automatically positions the red cursor over the right-most peak it finds in the sample.
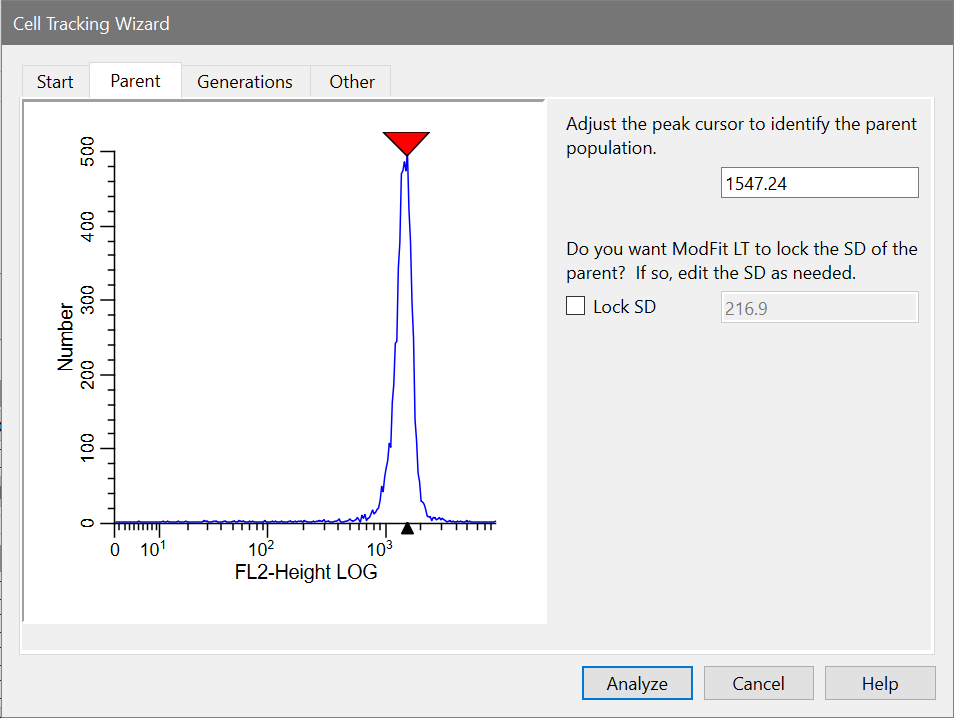
This tab also allows you to "lock" the standard deviation (SD) of the Gaussian component used to model the parent population. This option is most useful when analyzing samples in which there is a great deal of proliferation. In these cases, the parent population is often difficult for the model to resolve, and the modeling process broadens the SD of the parent too much. For this example, leave this option unchecked.
Normally, you will not need to make adjustments on this tab. It allows you to review and edit the number of generations to model and the type of model to use.
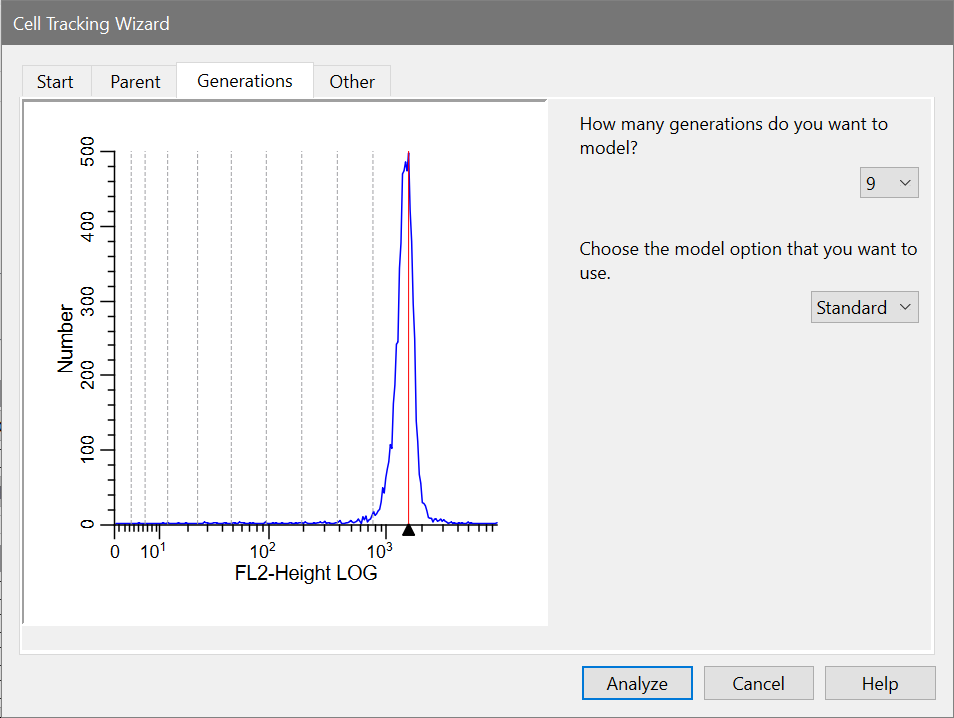
The wizard provides two variations for modeling the generations: Standard and Floating. In the Standard mode, the mean position of the Gaussian for each generation is dependent on the position of the parent generation. For example, if the parent population is located at 2000, the first generation will be located at half the parent location, or 1000. Each generation will be at half the location of the previous generation.
The floating option allows the mean of each generation to be computed independently of the other populations. This option provides much greater flexibility to the model and will work well for samples with visually distinct generations. The floating option is not recommended for samples where generational boundaries are not obvious to the eye.
For our example, we do not need to adjust the Generations settings, and we will skip the Other tab for now.
Running the model
You are ready to analyze the first sample with your model.
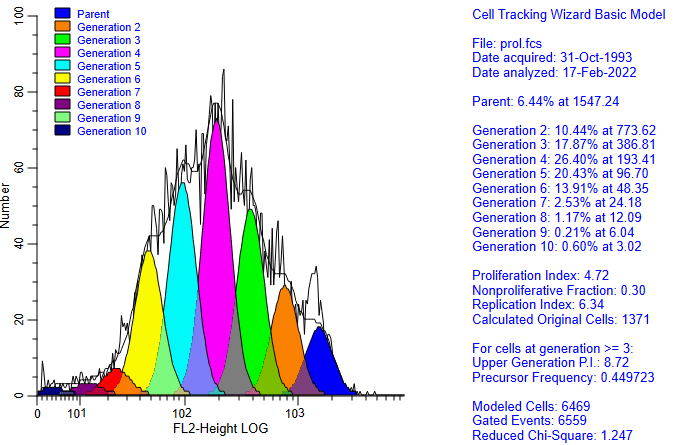
The wizard creates the model and analyzes the sample.
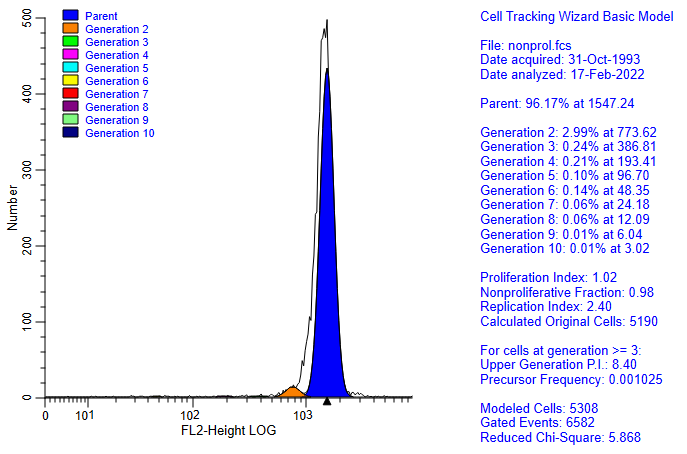
Percentages and means are reported for the parent and all generation populations. At this point you could add comments, print and save your report. You do not need to do that for the tutorial.
You will also notice the wizard toolbar is now docked at the bottom of the window.
The first button on the toolbar lets you open and analyze a data file in a single operation. The second re-displays the Cell Tracking Wizard dialog so that you can edit the model. And the third lets you exit the Cell Tracking Wizard. These options are also available via the cell track wizard button on the ribbon bar.
Opening and analyzing new data files
After setting up the model on a non-proliferating sample, you are ready to open and analyze the samples collected at subsequent time points. For our tutorial, we have one proliferating sample.
Adjusting the model
You may be interested in trying several other options in the Cell Tracking Wizard, found in the Other tab. To try these, you need to display the dialog.
On the Start tab, the Wizard has switched from "Create" to "Edit the current cell tracking model" automatically.
The other edit property on this tab defines the starting generation for "true proliferation." This value is used in the calculation of Upper Generation Proliferation Index and the Precursor Frequency. For a description of the use of Precursor Frequency, see "A flow cytometric method to estimate the precursor frequencies of cells proliferating in response to specific antigens", Givan, A., et al, Journal Of Immunological Methods Vol. 230, 1999 Elsevier Science B.V.
When you have finished with the Cell Tracking Wizard, click the Quit button on the wizard toolbar. The Wizard will ask whether you are finished using the Wizard. Choose Yes to exit the Wizard.
Summary
The Cell Tracking Wizard is a tool designed to allow you to easily analyze samples prepared with cell tracking dyes. It is organized by categories into tabs which allow you to describe your data and choose options to use in modeling your data.
Once you have created a model with the Wizard, the Wizard toolbar is displayed. It provides shortcuts to opening and analyzing samples, adjusting the Cell Tracking Wizard settings, and quitting the Wizard.
See also: