
This dialog allows stages to be added, deleted, and modified. Stages are defined on the Progression (State Index) axis and provide statistics and coloring for portions of the progression.
Stages are most often defined using Definition Points in the Expression Profiles for a given Cell Type. This allows the boundaries of the stage to adjust automatically as the Definition Points are adjusted.
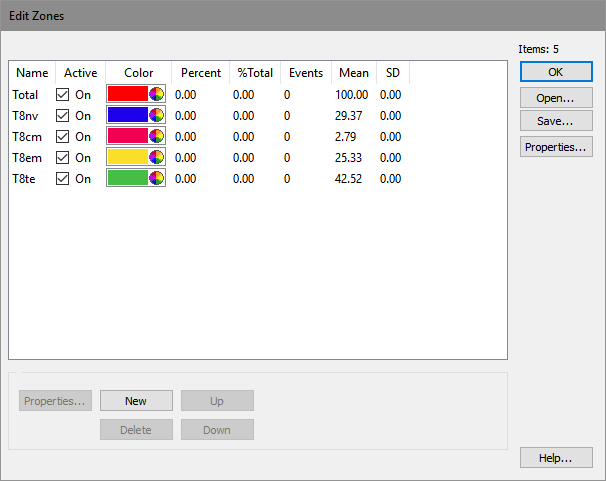
Each stage has a name and color. The color is used when drawing dots that fall within the stage's boundaries and along the top of Overlay plots when stages are displayed. If overlapping stages are defined, the color of the last stage containing an event is used to color dots for that event.
A Stage Table object appears on each Cell Type to provide statistics for the stages. The table shows the name, color, active state, and statistics for each stage.
See Edit Properties for Stage for additional details on stage properties.
If you want to... |
|
Add a new stage |
Click the New button and fill in the Edit Properties for Stage dialog. |
Delete a stage |
Select the stage in the list, and then click Delete. |
Change the order of stages |
Select a stage, and then use the Up or Down button to move it in the list of stages. |