This tutorial will introduce kinetic analysis of calcium flux experiments using WinList and Microsoft Excel. The first section of the tutorial shows how this can be done manually by copying results from WinList into a special Excel worksheet designed for kinetics. At the end of the tutorial, we will show how the process can be automated with a WinList macro and an Excel Visual Basic script.
In order to perform this tutorial, you need WinList and Microsoft Excel installed on your computer. You will also need sample files that can be found in WinList's Samples\Kinetics folder.
Set up Excel
1. Start Microsoft Excel.
2. From Excel's file menu, choose Open. Navigate to the folder in which WinList is installed, and into the Samples\Kinetics folder. Select the file WinListKinetics.xls.
3. Click the Open button.
You may need to adjust the macro security settings in Excel to enable macros in this worksheet. Talk with your IT specialist to determine if this is appropriate for your institution.
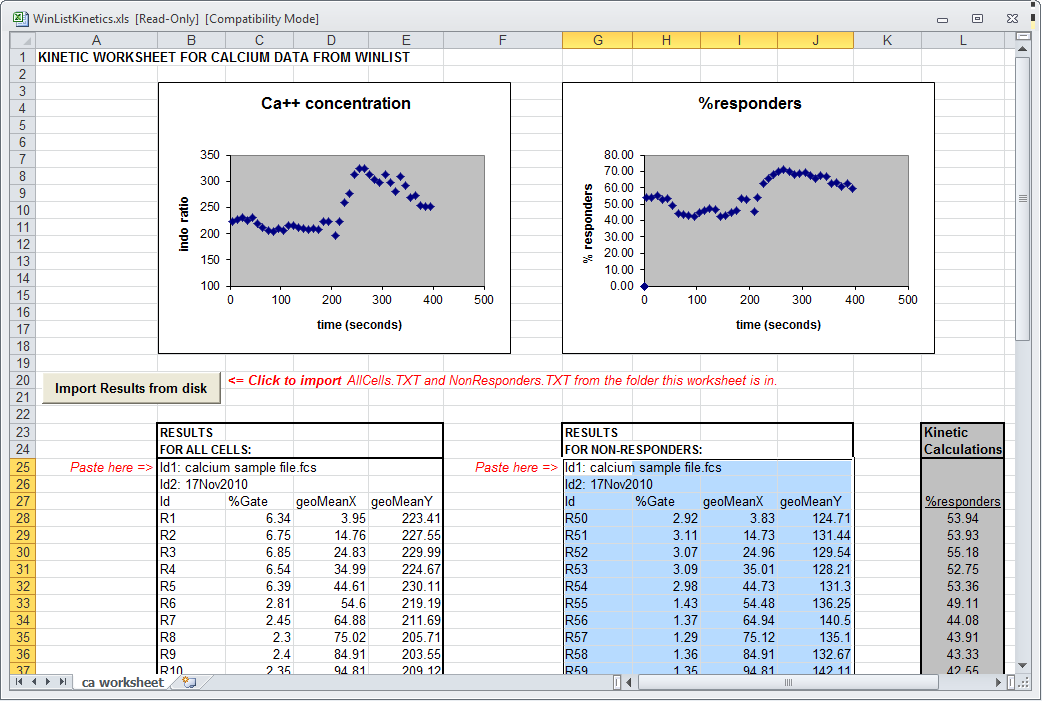
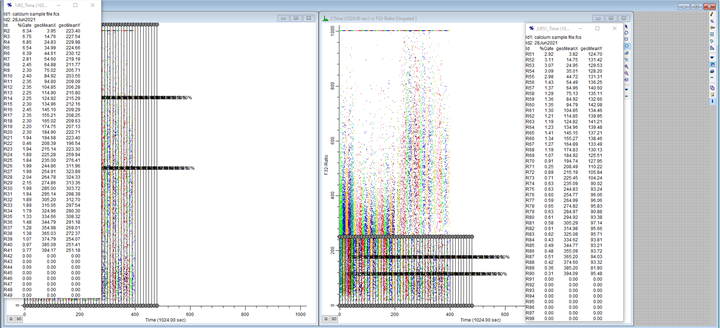
This worksheet contains two charts, one showing calcium concentration for all cells, and a second showing the calcium response of responder cells. The charts plot data from two sets of results pasted from WinList. You will be pasting new results into this worksheet to update the charts with your analysis of a sample file.
If Excel displays a security warning, you will need to choose to Enable Content in order for the sheet to work properly.
Set up WinList
4. Start WinList, and click Open FCS on the ribbon bar. The Open FCS File dialog is displayed.
5. Navigate to the folder in which WinList is installed, and into the Samples\Kinetics folder. Select the file calcium sample file.fcs, and click the Open button.
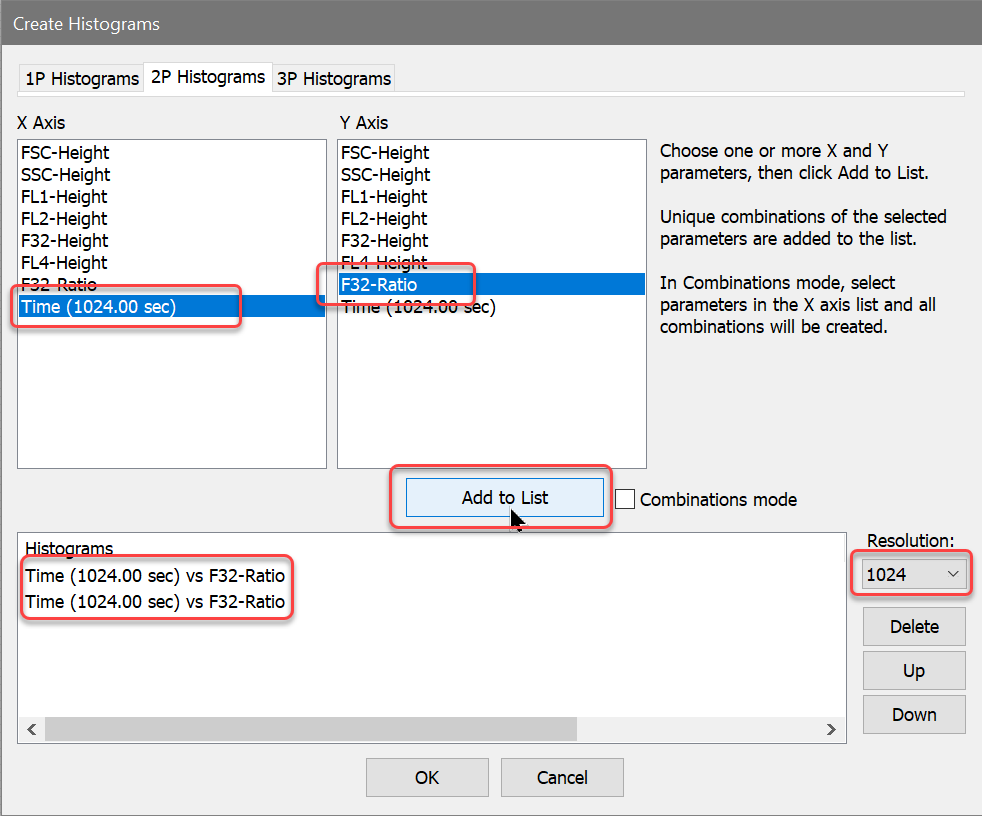
The Create Histograms dialog is displayed. We want to create two copies of Time vs. F32-Ratio at a resolution of 1024 channels.
6. Set the Resolution dropdown list to 1024.
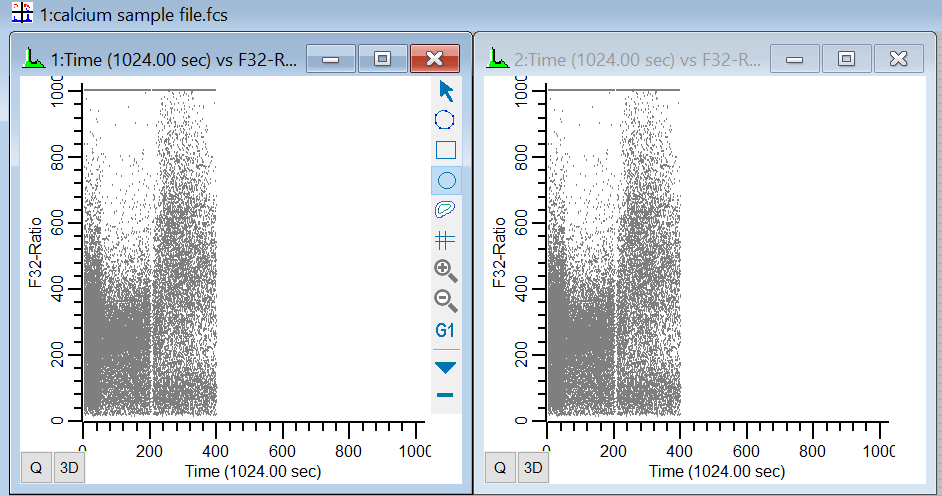
7. Select Time in the X Axis list, F32-Ratio in the Y Axis list, and then click Add to List two times. You should see two entries in the Added Histograms list. Click OK to close the dialog and display the histograms.
We need to display all dots, and turn off contours if they are enabled.
8. Right-click the mouse on one of the histograms.
9. From the popup menu, choose Graphics. Select Dots in the tree on the left and make sure Dots are enabled. Check the Show all dots option. Select Contours in the tree and make sure that the Contours property is disabled. Scroll to the bottom of the property list and check Apply to All. Click OK to apply the changes to both histograms.
Create regions and results
Next, we need to create a set of regions on each histogram to provide statistics on the kinetics. In the histogram on the left, we will gather statistics about all cells, and in the right histogram, we will look at statistics for a subset of cells. We will use the Create Region Array option to simplify the process of creating 48 adjacent regions on each histogram.
10. Click the title bar of the histogram on the left to activate it. From the Insert tab on the ribbon bar, click Region Array.
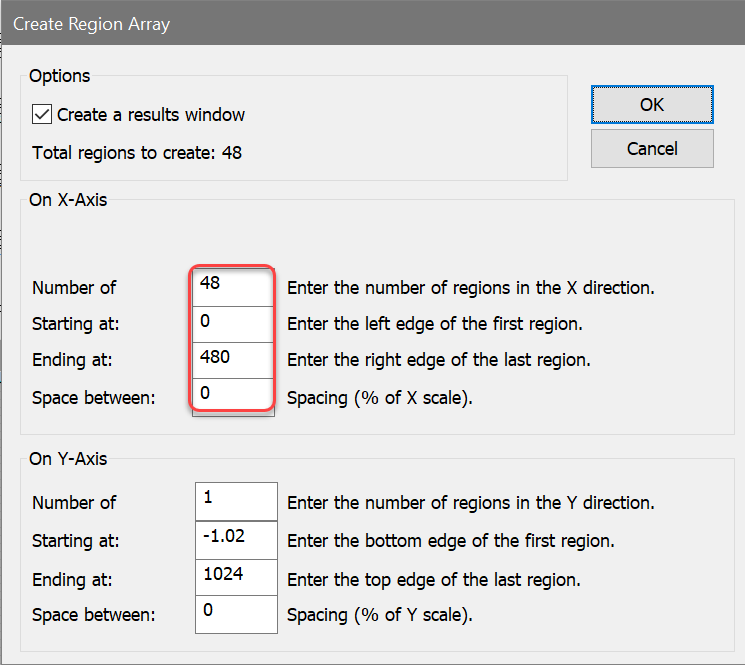
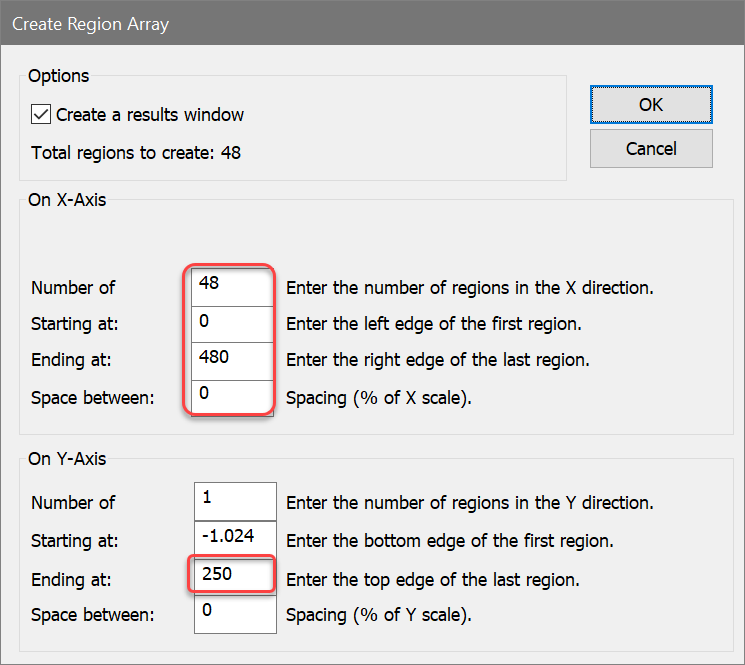
We want to create 48 regions on the X-axis, each one being 10 channels wide.
11. In the On X-Axis group, enter 48 for the Number of regions. Enter 0 for Starting at, and 480 in the Ending at edit box. Click OK.
After a moment or two, a results window containing results for the 48 regions will appear. We need to choose the statistics to display.
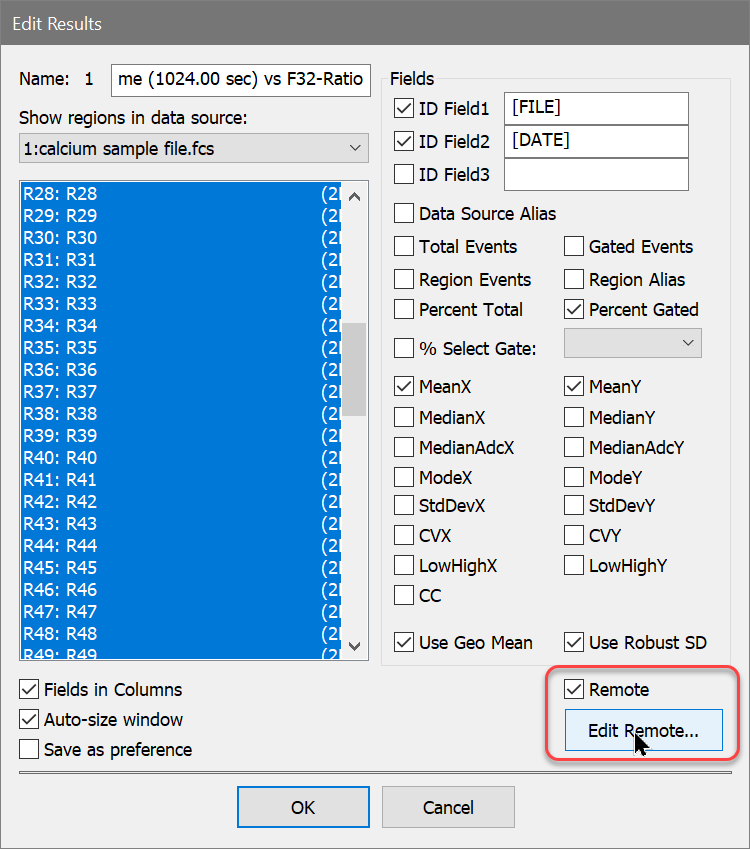
12. Right-click on the results window and choose Edit from the context menu. Enable the following options, and disable all others:
ID Field1
ID Field2
Percent Gated
MeanX
MeanY
Use Geo Mean
Use Robust SD
Fields in Columns
Click OK to close the dialog.
You can set the preferences for the results that you want in a new results window by clicking the Save As Preference button in the Edit Results dialog.
Next, we will repeat the process for the second histogram. This time, however, we will create slightly different regions.
13. Click the title bar of the histogram on the right to activate it. From the Insert tab on the ribbon bar, click Region Array.
14. In the On X-Axis group, enter 48 for the Number of regions. Enter 0 for Starting at and 480 in the Ending at edit box. In the On Y-Axis group, enter 250 for the Ending at edit box. These regions will capture the non-responders. Click OK.
A second Results window will appear. Once again, we need to choose the statistics to display.
15. Right-click on the new Results window and choose Edit. Enable the following options again, and disable all others:
ID Field1
ID Field2
Percent Gated
MeanX
MeanY
Use Geo Mean
Use Robust SD
Fields in Columns
Click OK to close the dialog.
WinList is all set and ready to go. If you want to keep this setup as a protocol, use the Save Protocol option on the Home tab of the ribbon.
Copying results into Excel
We need to update the statistics for the entire file, and then copy the two sets of results into the Excel worksheet.
16. Click the Replay button on the Home tab of the ribbon bar.
17. Right click inside the first Results window. Choose Copy.
The first set of results is now in the clipboard, available to Excel. We need to paste these results into the correct cells in the Excel worksheet.
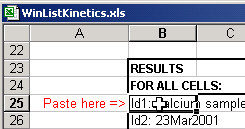
18. Activate Microsoft Excel. Select cell B25 and then Paste the results.
Now, we repeat the process for the second set of results.
19. Activate WinList. Right click inside the second Results window. Choose Copy.
The second set of results is now in the clipboard, ready to paste into Excel.
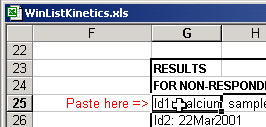
20. Activate Microsoft Excel. Select cell G25 and Paste the results.
The Excel worksheet now displays two charts of the results you have just pasted into it. The chart on the left shows the Calcium concentration for all cells, and the chart on the right is for the "responder" cells. Notice that there is also a column of numbers that displays the percentage of responders for each time slice.
Automating the process
Since WinList and Excel both have automation capabilities, you can streamline the process of getting results into Excel. The best way to do this is with a Remote connection between each Result window and the Excel worksheet.
21. Activate WinList, right-click the first Results window, and choose Edit.
22. In the Edit Results dialog, enable the Remote checkbox and then click Edit Remote.
23. The Edit Remote Link dialog is displayed. Select "Excel" in the Link To list, and then type "ca worksheet" for the Topic.
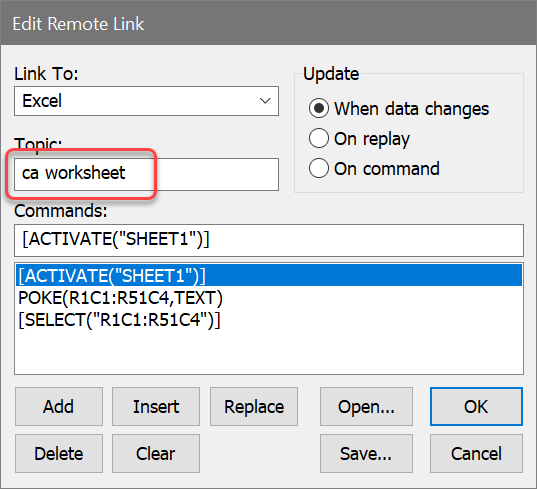
24. Next, select the first command in the Commands list, edit "SHEET1" to "ca worksheet", and then click the Replace button.
25. Select the second command in the Commands list, edit the text to "POKE(R25C2:R76C5,TEXT)", and then click the Replace button. This tells Excel where to put the results data that WinList will send to it.
26. Select the last command and click the Delete button.
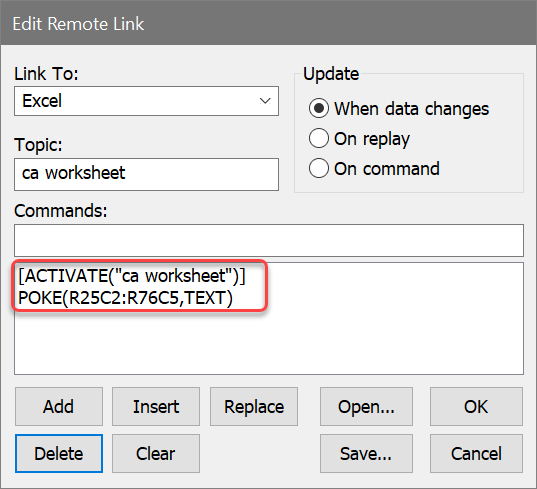
Click OK to close the dialog.
We have edited the script so that any time our data changes, WinList will send the new results to the correct location on the Excel spreadsheet. Let's make a similar connection for the second Results window.
27. Right-click the second Results window and choose Edit. Enable the Remote checkbox, and click Edit Remote.
28. Edit the Topic to "ca worksheet" and revise the script commands as shown. Note the text of the POKE command is different than the previous script: "POKE(R25C7:R76C10,TEXT)".
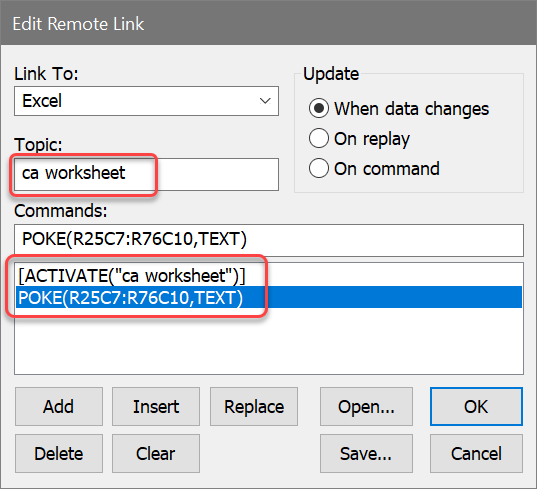
29. Click OK to close the dialog, and click OK again to close the Edit Results dialog.
You now have a fully automated connection between Excel and WinList for both of the Result windows. Any time you load a new file or change a gate, WinList will send the new Results to Excel using the scripts we just created. If you save your protocol, the remote scripts will be stored and connections will be made automatically when the protocol is re-opened.
Summary and discussion
This tutorial introduced kinetic analysis using WinList and Microsoft Excel. We constructed a protocol in WinList that extracted statistics from 48 time slice regions in each of two histograms. We opened an Excel spreadsheet that is supplied with WinList, and then pasted two sets of results into the worksheet.
We streamlined the process of copying and pasting results by creating Remote connections between the Result windows and Excel.