MultiGraph windows can contain graphic and text elements from histogram and results windows, and allow you to display and print the collection in various views. They have a more restricted format than reports and do not update elements when data changes. However, they are a useful tool for creating summary information about experiments in a graphical record. In this tutorial, you will review how to open a listmode data file, create histograms, and learn how to select histograms and results for inclusion in a MultiGraph window.
Before you begin, make sure you understand the basics of working with WinList. The tutorial WinList Basics is a great place to start.
Setting up
1. Click the Open FCS button on the ribbon bar. Navigate to the Samples folder, select 1091901.fcs in the list, and then click Open.
2. Use the Create Histograms dialog to create several 1P and 2P histograms. Click OK.
3. Click the Q button in the lower left corner of each of the 2P histograms. This will create a QuadStat region, and automatically display a results window for it. Adjust the QuadStats.
Creating the MultiGraph
At this point, we have created what we want to store in the MultiGraph. Next, we will create the MultiGraph and add this information to it.
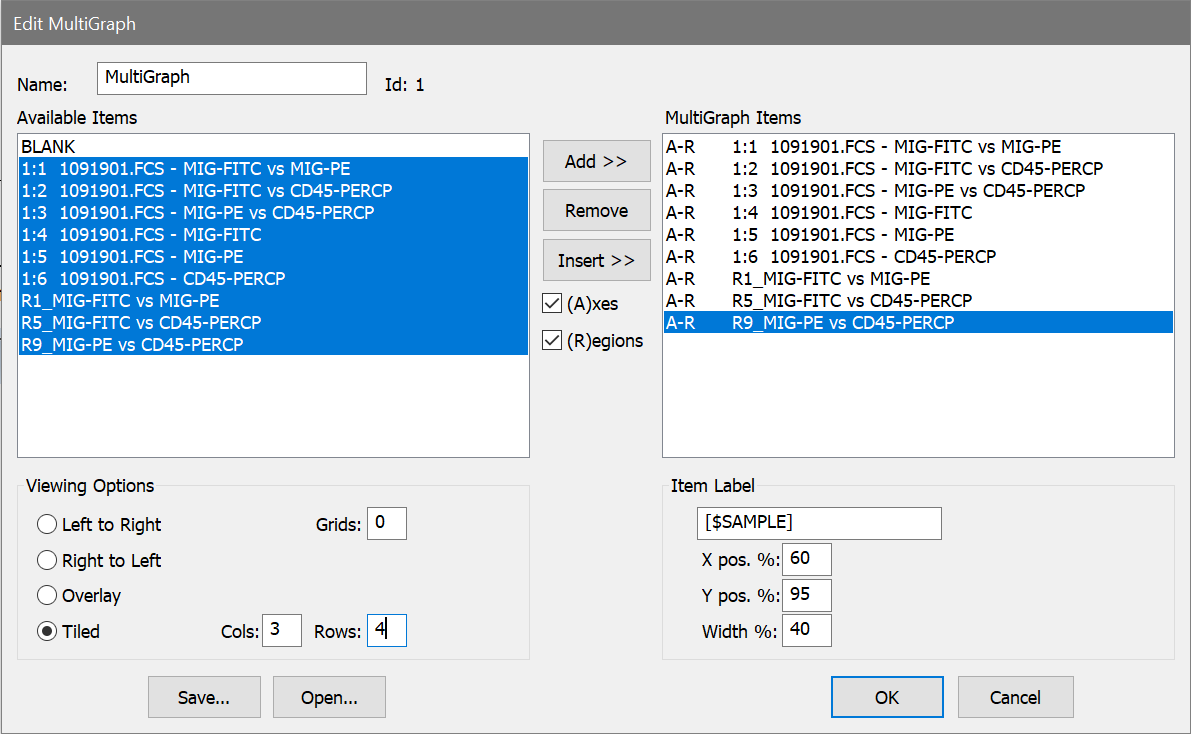
4. Click the MultiGraph button on the ribbon bar. The Edit MultiGraph dialog box will appear. The dialog box displays all of the items that you can add into the MultiGraph in the Available Items list. As we add items, they will appear in the MultiGraph Items list.
5. In the Available Items list box, select all entries, except for BLANK. Click the Add button.
"BLANK" is always the first entry in the Available Items list box. It allows you to put a placeholder, of sorts, into the MultiGraph. It is useful when attempting to keep elements in proper columns and rows.
6. In the Viewing Options section, click Tiled, and enter 3 and 4 in the Columns and Rows edit boxes, respectively. This means that we will display the elements in a 3 x 4 array. If we were to add more than 12 elements, additional pages would be created automatically.
7. Click OK to close the dialog box and create the MultiGraph.
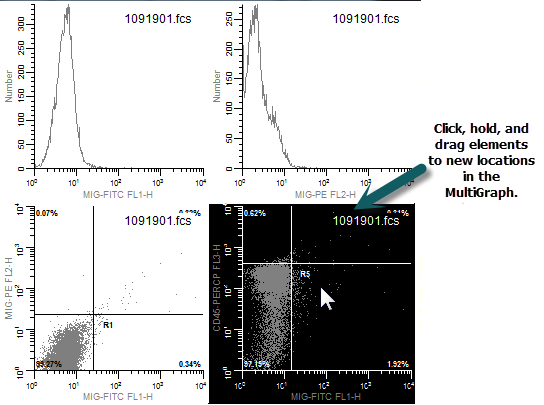
The MultiGraph will show the histograms and results that we added. Elements in the MultiGraph will not change, even if the histograms from which they were generated do. This means that you can use the MultiGraph to archive graphical and statistical information. You can also add elements from numerous data files to a single MultiGraph.
Note, the item label that is shown on each element of the MultiGraph is set by a setting in MultiGraph Preferences. By default it is set to the $SAMPLE keyword, which the FCS file we have opened does not contain, so the label shows $SAMPLE in this case. Set the preference to a keyword that provides useful information for your FCS files.
Changing the arrangement
You can move elements around on a MultiGraph page by using the mouse.
8. Click and hold the mouse on one of the elements in the MultiGraph. Move the mouse to a new location in the MultiGraph, and release the button. The element will move to the new position, and other elements will adjust to accommodate the change.
Summary
In this tutorial, we introduced the MultiGraph, a type of window that can contain graphics and text from histogram and result windows. MultiGraphs can collect elements from numerous data files, display them in one window, and print them. The can also be exported to PDF format.
The Edit MultiGraph dialog box allows selection of new elements, editing of labels, and a choice of viewing options. MultiGraphs can also be saved to disk and opened from disk in this dialog box.
As with other types of windows in WinList, double-clicking on the title bar of the MultiGraph window is a shortcut to the Edit MultiGraph dialog box. There are also shortcuts for adding histograms and results windows to MultiGraphs.
MultiGraphs have a popup menu that allows you to perform common MultiGraph tasks quickly. In addition, tiled MultiGraphs allow you to move elements by a click-hold-and-drag technique.