To display the dialog, choose Preferences from the File (Application) menu or the Options tab of the ribbon bar. In the menu & toolbar interface, the command is in the Options menu.
These preferences apply to all histogram types.
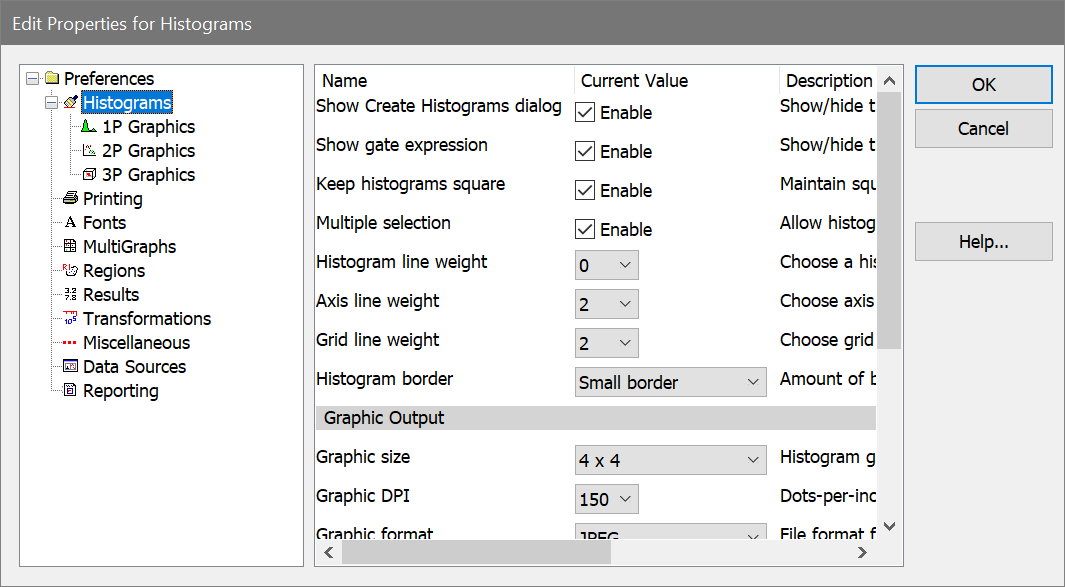
Show Create Histograms dialog
When enabled, the Create Histograms dialog is displayed whenever a new data source is created.
Show gate expression
When enabled, the gate expression appears in the title bar of each histogram
Keep histograms square
When enabled, the window arranging commands will always keep histograms windows square.
Multiple selection
When enabled, you can select more than one histogram window by pressing the Ctrl key on the keyboard. This can be used for moving and sizing histograms, as well as for drag-and-drop and some graphics properties.
Histogram line weight
Choose a weight of the line used to draw 1P histograms. Sizes are in 1/2 points, (a point is 0.35 mm or 1/72 in).
Axis line weight
Choose a weight of the line used to draw axis borders and tics. Sizes are in 1/2 points, (a point is 0.35 mm or 1/72 in).
Grid line weight
Choose a weight of the line used to grids on histograms. Sizes are in 1/2 points, (a point is 0.35 mm or 1/72 in).
Histogram border
Choose how much space to allow between the graphics and the window border for all histograms.
Graphic Output
Graphic size
The value specifies the virtual size for a histogram window when creating a picture (metafile) of the histogram to copy to the clipboard. When you paste the picture into another application and display it at the specified size, it will look best at the target size you select here. Enter a larger value to reduce the size of fonts in the picture relative to other aspects of the histogram, or a smaller size to increase the fonts.
See also MultiGraph Preferences for setting the target size for images added to MultiGraphs.
Graphic DPI
This property specifies the dots-per-inch, or DPI, used when copying a histogram graphic to the clipboard or saving it to disk. Higher values provide better quality output but require more memory.
Graphic format
This property determines the file format used when saving graphics to disk. Choose the format that you most commonly use.
Colors
Palette mode
This property determines what palette mode is used when histograms are copied, printed, or updated on a report.
Use normal palette uses the normal background and foreground colors, Use inverse palette uses the reverse background and foreground colors, and Use current view will use same palette mode that is currently displayed.
Copy background color
Enable this property if you want the background color of histograms included when the histogram is copied.
Grid color
Choose a color from the standard color dialog to use for grids on histograms.
Save preferences
When checked, these preferences will be stored as new default preferences when you click OK to close the dialog. If unchecked, changes are only applied to this session of the program.