In the previous tutorial, Starting a New Project from Scratch, you set up the analysis of CD4 T cells and ended up with a nice report and database of results.
In this tutorial, you will add two more cell types to the analysis: CD8 T and NK cell types. You will use the Cell Type Wizard to add a cell type and test each cell type before moving on to the next one. This iterative process is the recommended approach, as it tests each enhancement incrementally.
This tutorial continues to build the Project that was started in the following tutorial:
Develop: Starting a New Project from Scratch
Start Gemstone by following the instructions in the Installation and Setup of GemStone section.
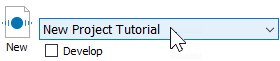
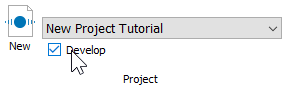
Open the "New Project Tutorial" Project that you created in the previous tutorial by selecting it in the Project dropdown list.
Click the Develop checkbox to enable develop mode.
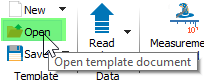
On the Develop tab, click the Open Template button.
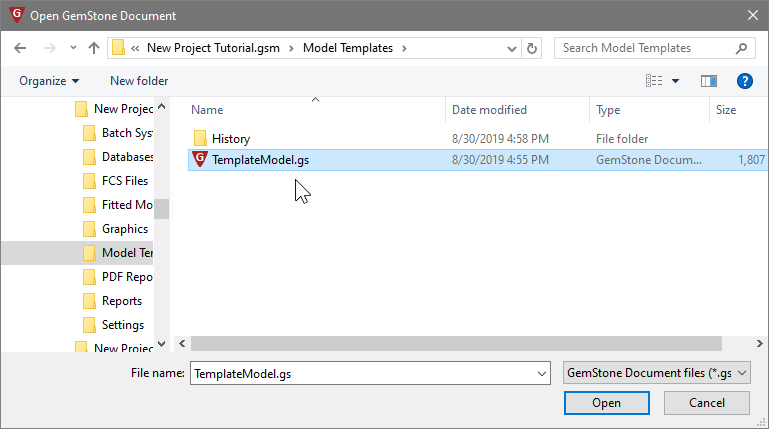
Select "TemplateModel.gs" in the Open GemStone Document dialog and click Open.
Click the first file in the list, and then read the FCS file by clicking the Read File button. This will read the file into the template without auto-analyzing it.
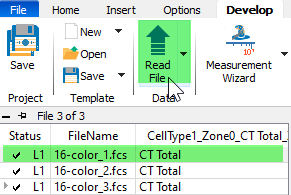
Click the Cell Type Wizard button to start the wizard.

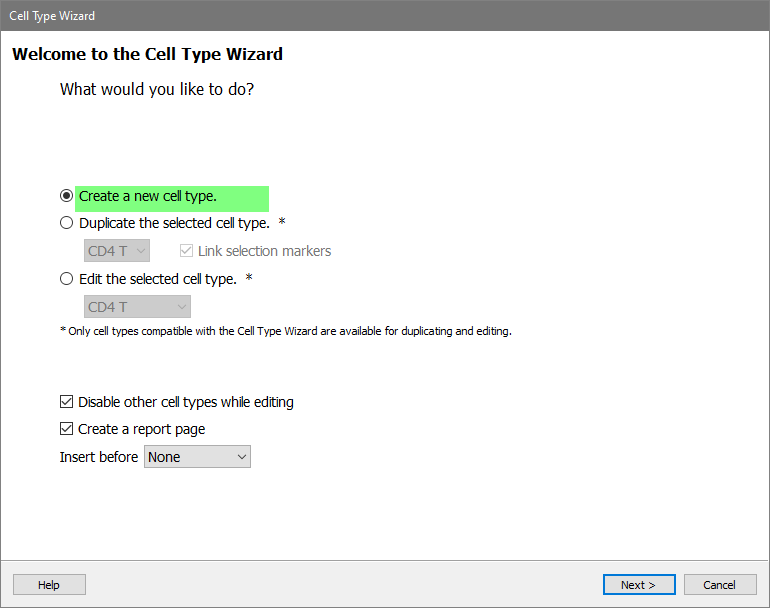
In the Cell Type Wizard dialog, select Create a new cell type and click Next.
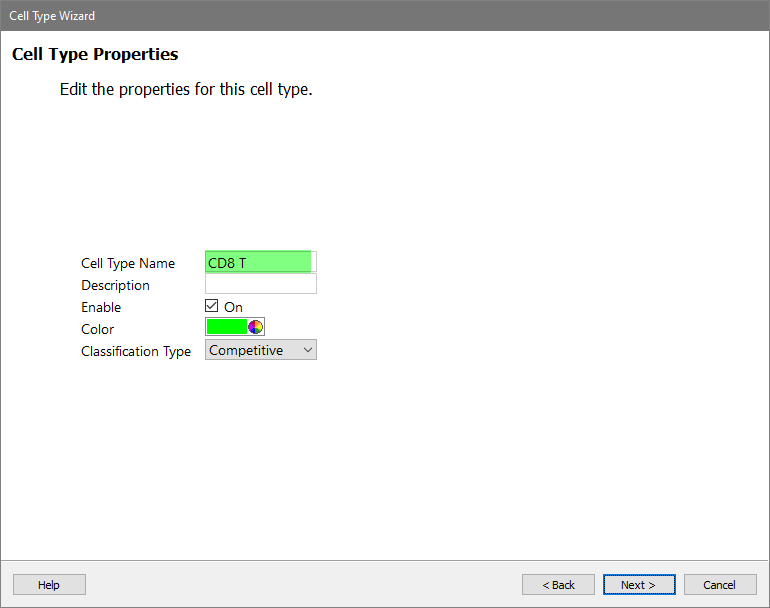
For the Cell Type Name enter "CD8 T" and click Next.
In the Available Markers list, click each of these markers in order: SSC-A, CD3, CD4, and CD8. The markers will be added to the Selection Markers list.
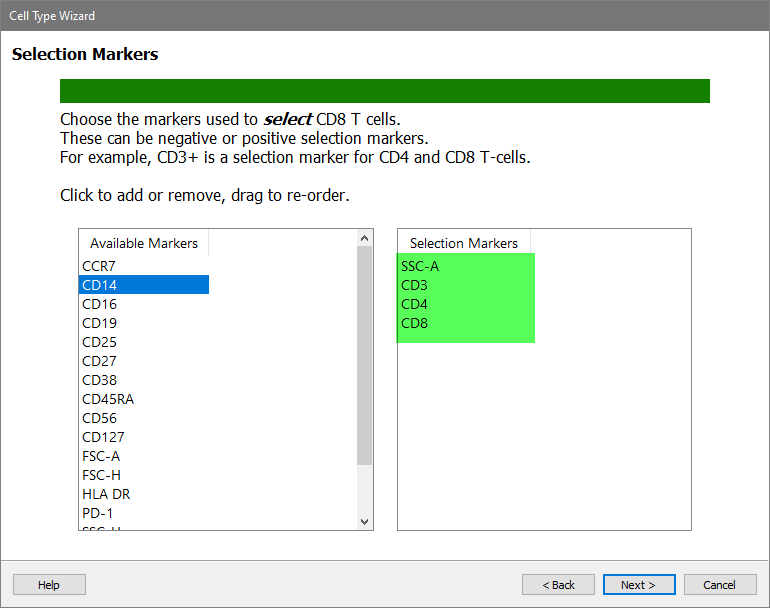
Click Next.
In the Available Markers list, click each of these markers in order: CCR7 and CD27. The markers will be added to the Staging Markers list.
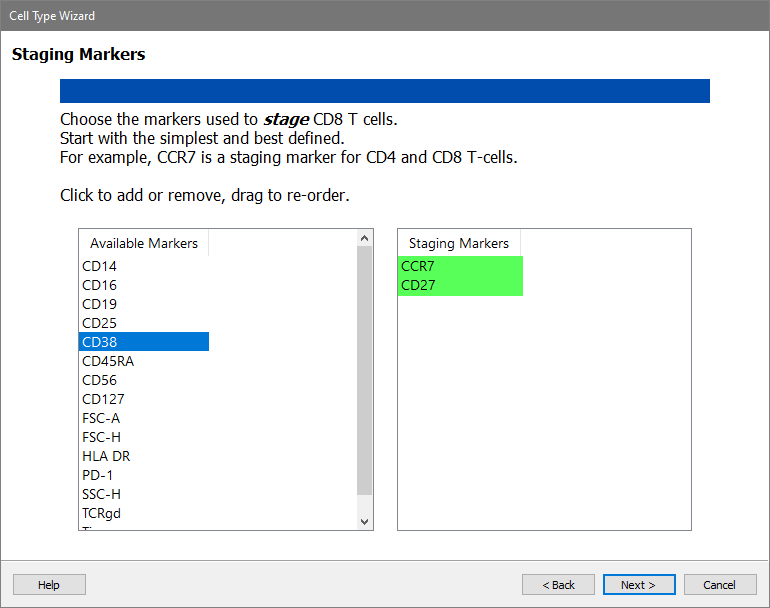
Click Next.
In the Available Markers list, click each of these markers in order: CD38 and HLA DR. The markers will be added to the Functional Markers list.
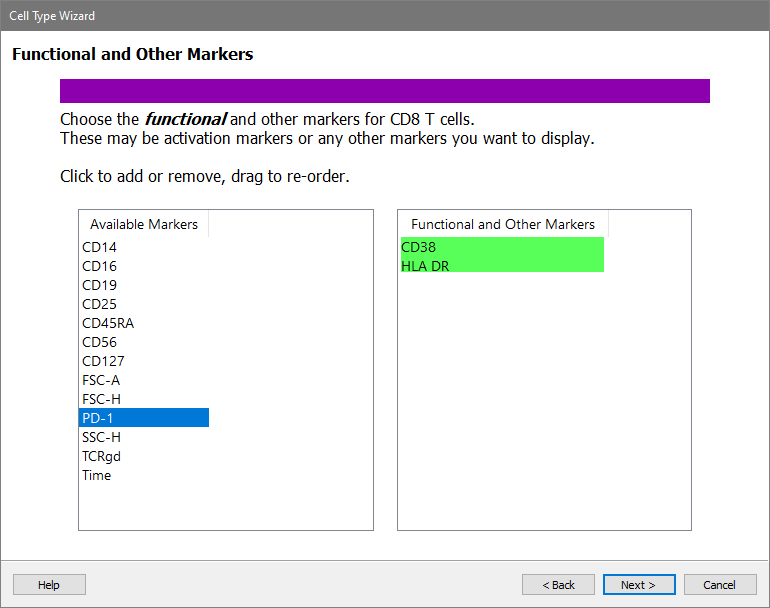
Click Next.
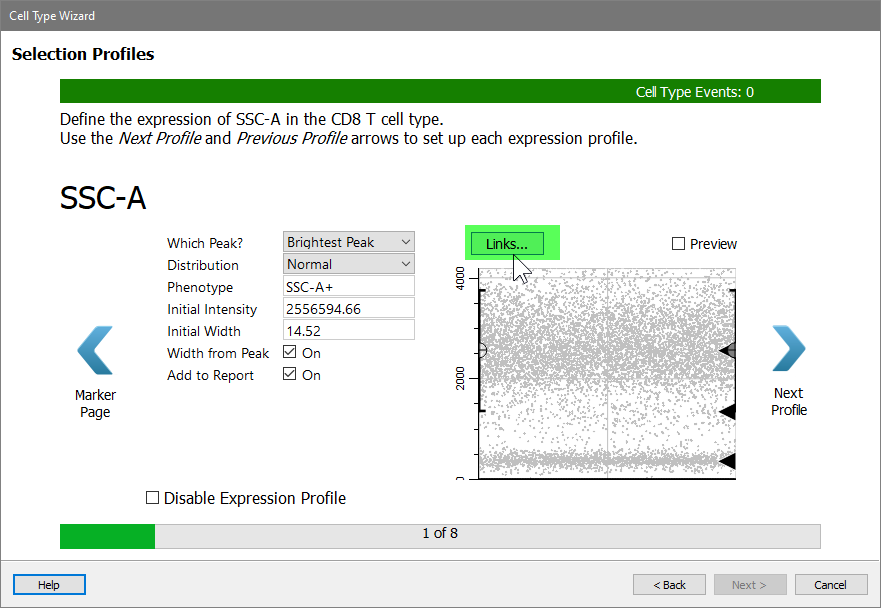
SSC-A is the first selection marker, and you will use a new technique to set up its expression profile. When you setup the CD4 T cell type, you tracked the dimmest peak of SSC-A. That's what we want to do for the CD8 T cell type, too. When two cell types set up a marker in the same way, you can "link" them together. Linking expression profiles speeds up the analysis and ensures consistency in how the profiles are set up.
Click the Links button.
In the menu of choices, choose CD4 T: SSC-A.
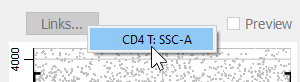
When the link is made, the properties for the CD8 T SSC-A measurement are set by the CD4 marker in the CD4 cell type. The profile switches into Preview mode automatically.
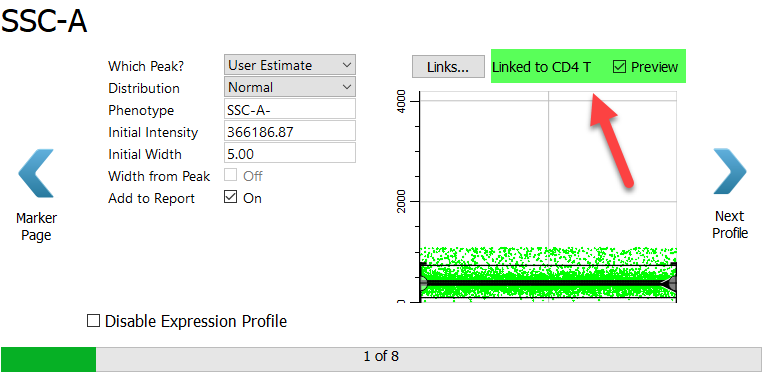
Click Next Profile.
Use the same technique for CD3.
Click the Links button and select the "CD4 T: CD3" profile.
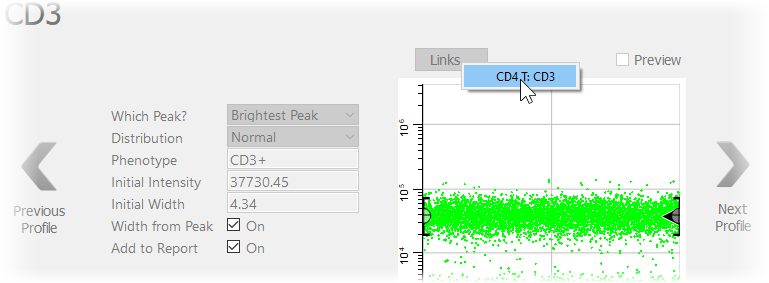
Again, after the link is made the profile switches to Preview mode.
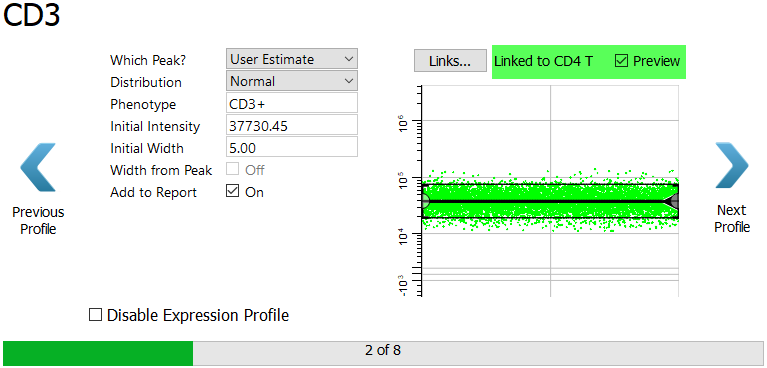
Click Next Profile.
For the CD4 marker in the CD8 T cell type, select Dimmest Peak and Low Pass. As we saw earlier, the Low Pass profile captures events that are below the top of the expression profile..
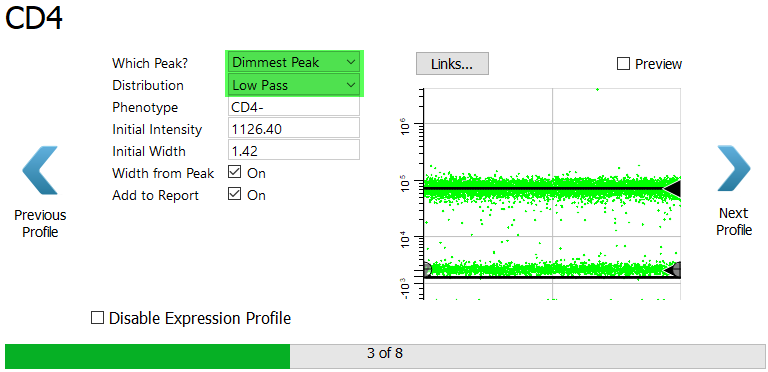
Click Next Profile.
For CD8 we are interested in the dim to bright CD8 events. Let's learn another trick to capture these events.
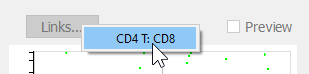
Click the Links button.
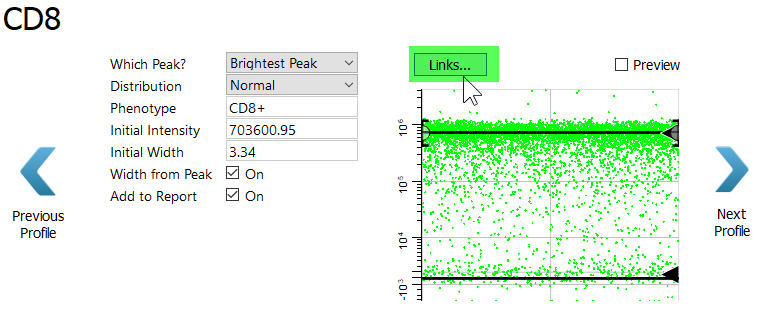
In the menu, select "CD4 T: CD8".
This may seem like a mistake at first, because the CD8 expression in the CD4 T cell type is not the expression level for the CD8 T cell type. In fact, it is the opposite. For the CD8 T cell type the cells of interest have dim to bright expression of CD8.
Change the Distribution to Inverse Low Pass. The Inverse Low Pass distribution selects the events above the top of the profile, which are the dim to bright events.
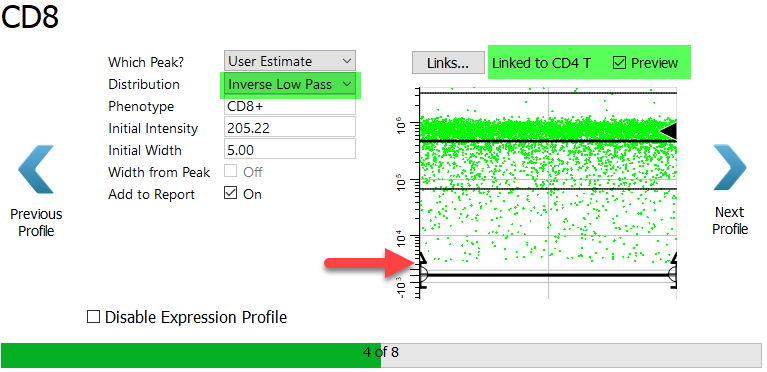
Click Next Profile.
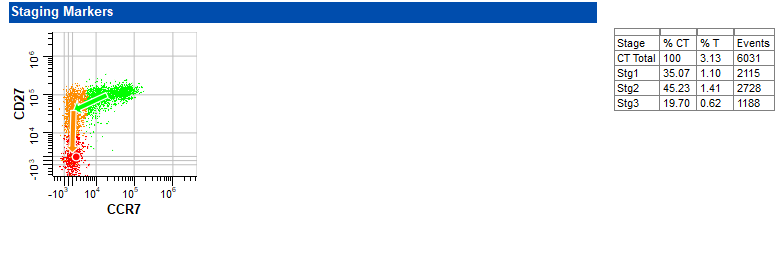
Moving on to the staging markers for the CD8 T cell type, the first is CCR7. This marker is abundant on early CD8 T cells, and is lost as they mature.
Select StepDown for the Expression Profile Shape.
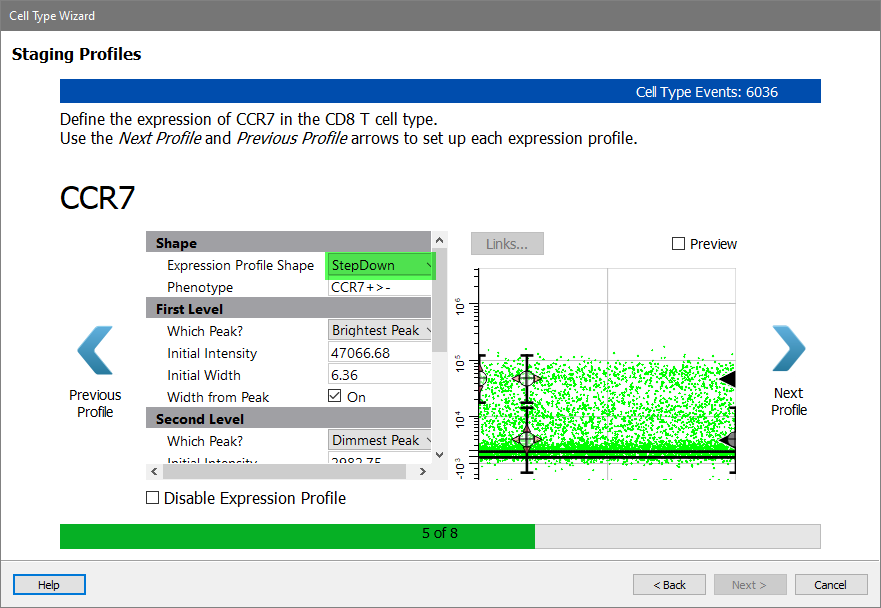
Enable the Preview checkbox to see how the StepDown profile fits the two levels of expression for CCR7.
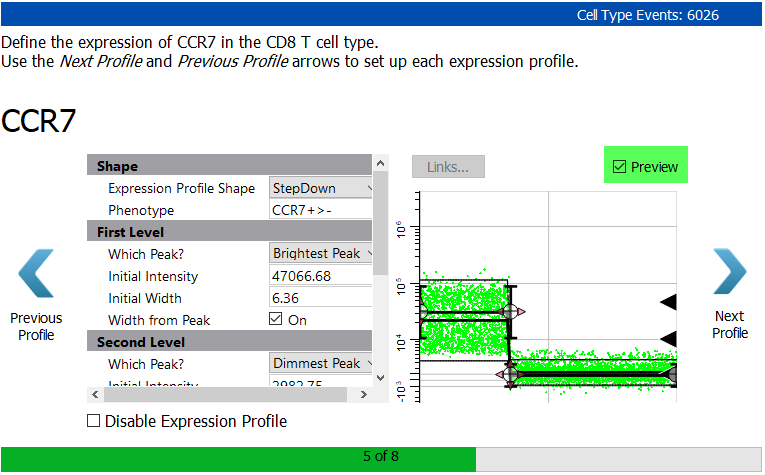
Click Next Profile.
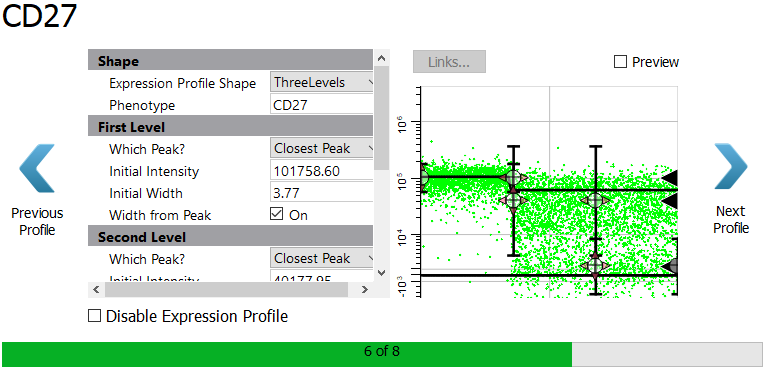
The program suggests a ThreeLevels profile shape for CD27 because it detects three levels of expression. There may indeed be three levels of expression, but they are not clearly distinguishable in this data. We will choose a simpler profile shape.
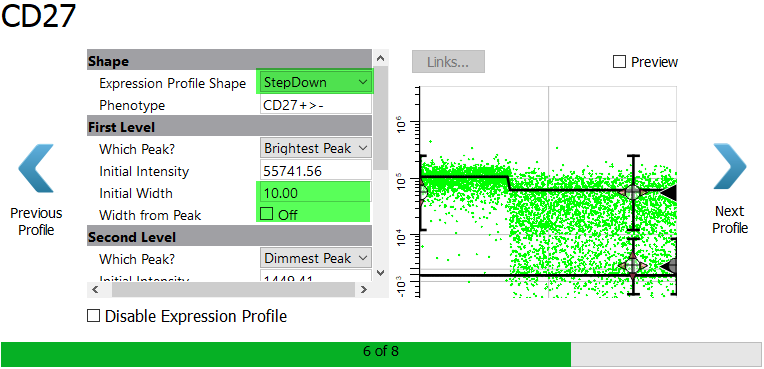
Select StepDown for the Expression Profile Shape. For the Initial Width type 10.00 and uncheck Width from Peak. Using a larger, fixed width for the bright peak will allow the program to capture the two apparent levels of bright expression.
Enable the Preview checkbox. Notice that even with the StepDown profile, we can appreciate three levels of expression in CD27.
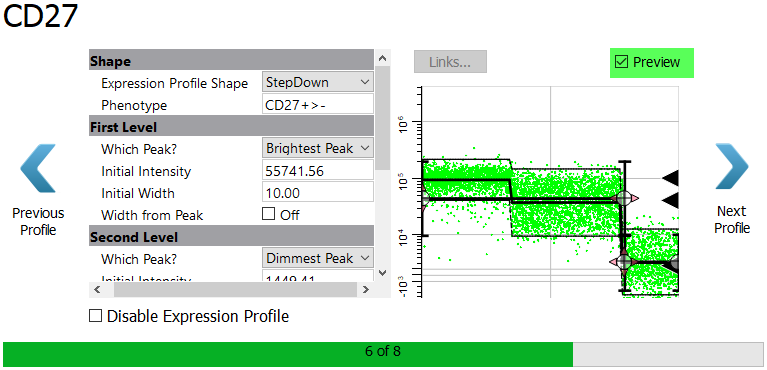
Click Next Profile.
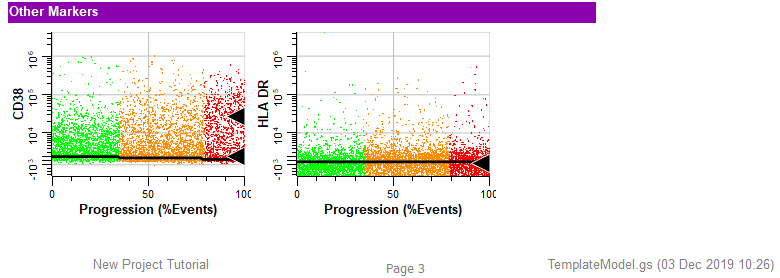
Next come the functional makers. For now, skip over these without setting up a profile.
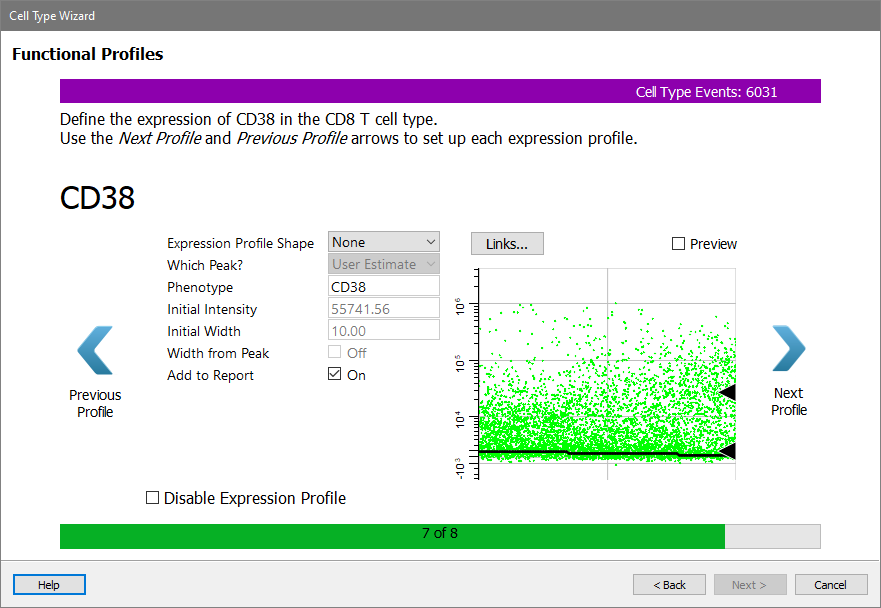
Click Next Profile to skip CD38.
The HLA DR profile is shown.
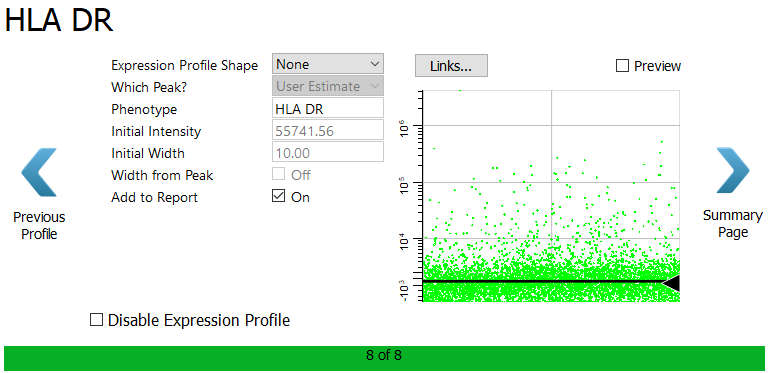
Click Summary Page to skip HLA DR.
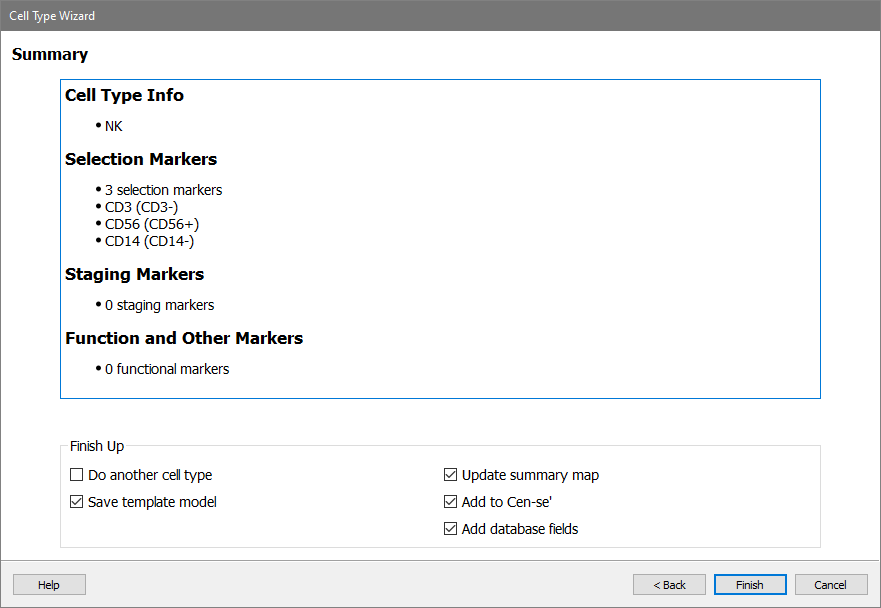
On the Summary page, review the summary information for the cell type. Make sure that Save template model, Update summary map, Add to Cen-se', and Add database fields checkboxes are enabled.
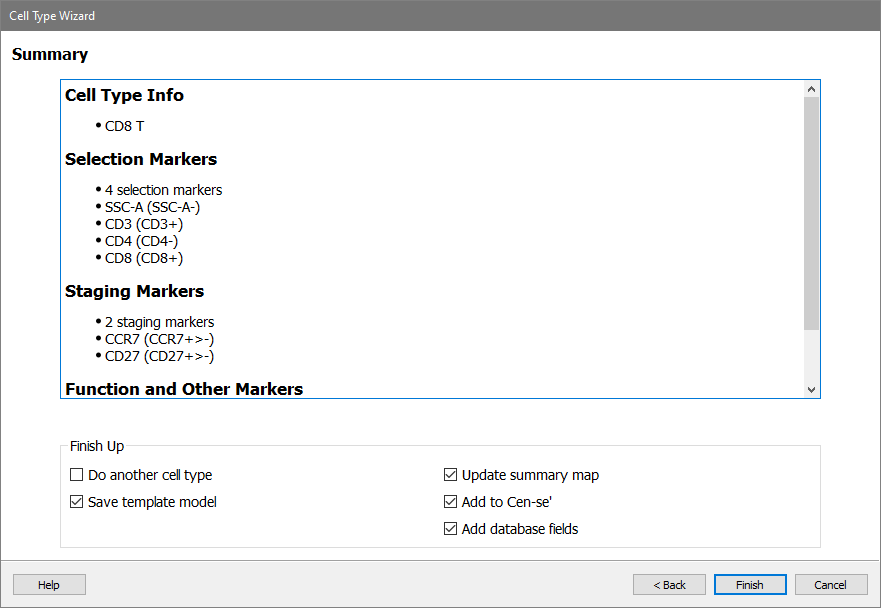
Click Finish.
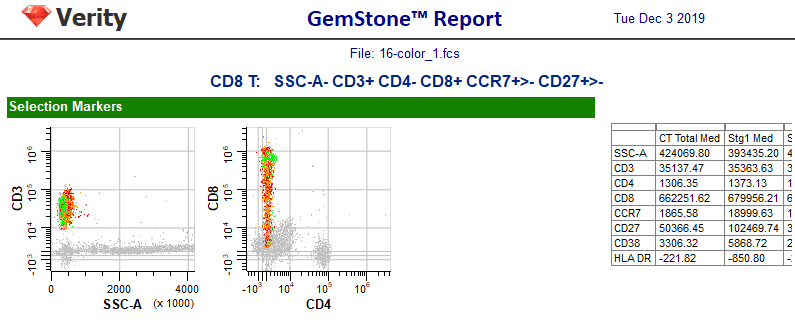
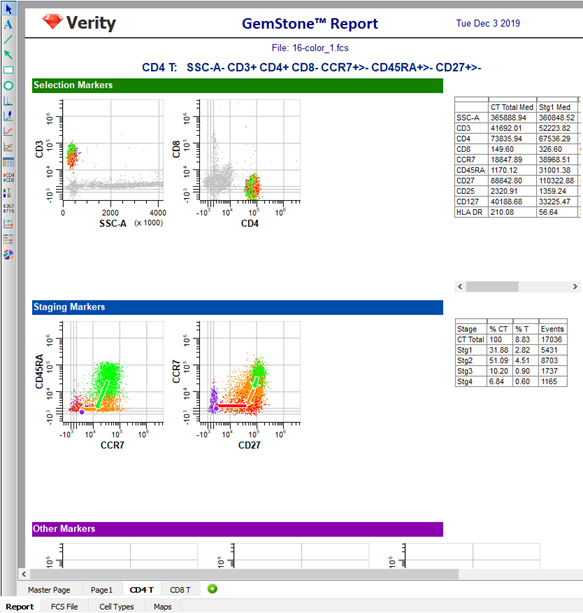
After the wizard closes, the changes you made to the model template will be saved and the wizard-created report page for CD8 will be displayed.
As we saw previously, the report page is divided into sections for Selection Markers, Staging Markers, and Other Markers. Plots in each section display the measurements that we added to the cell type. Tables are included to show median intensities for the markers and frequency information for the stages.
Each time a cell type is added or revised you should check how the new cell type affects other cell types in the model template.
The idea is to review each of the other cell types to make sure that nothing has changed dramatically.
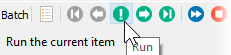
Click the Run button at the bottom of the batch list. This has the same function as the Run button on the Home tab, running the batch commands to process the selected FCS file.
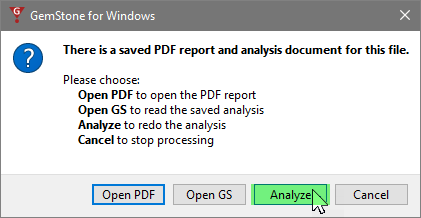
When prompted, choose Analyze to re-run the analysis of this FCS file with the modified template.
When the analysis is complete, select the CD4 T cell type page of the report by clicking the CD4 T tab at the bottom of the report pages. The distributions in the CD4 T cell type are almost identical to what they were with the original model template. This suggests that adding the CD8 T cell type did not adversely affect the CD4 T cell type.
Excellent. Let's move on to the next cell type.
The NK cell type is a very simple one, so let's add that one now.
Click the Cell Type Wizard button.
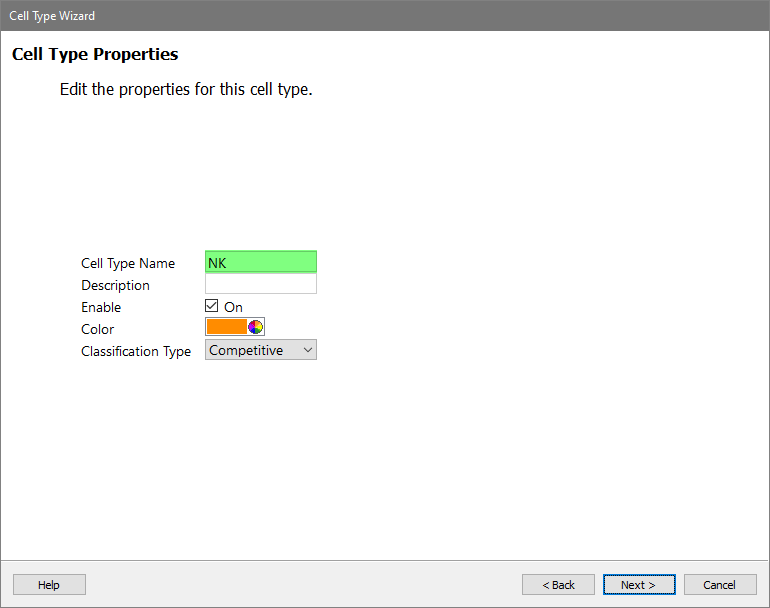
Choose Create a new cell type and click Next.
Type "NK" for the Cell Type Name and click Next.
Add three selection markers in order: CD3, CD56, and CD14.
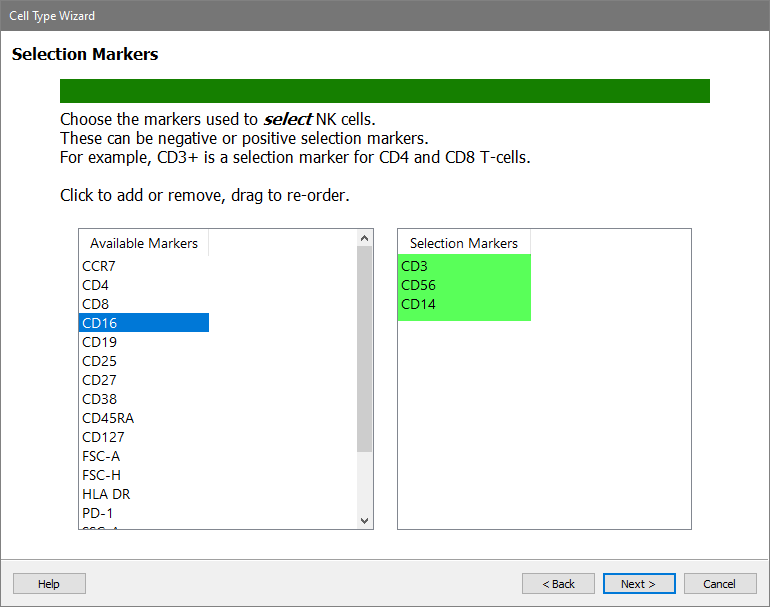
Click Next.
This cell type will not have any staging or functional markers.
Skip Staging and Functional by clicking Next for each of these pages.
For CD3, choose Dimmest Peak and Low Pass.
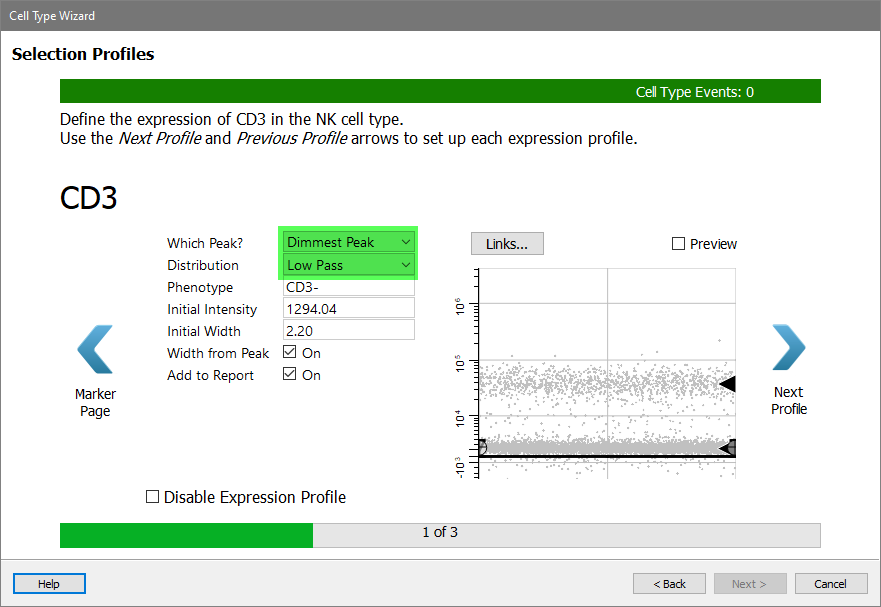
Click Next Profile.
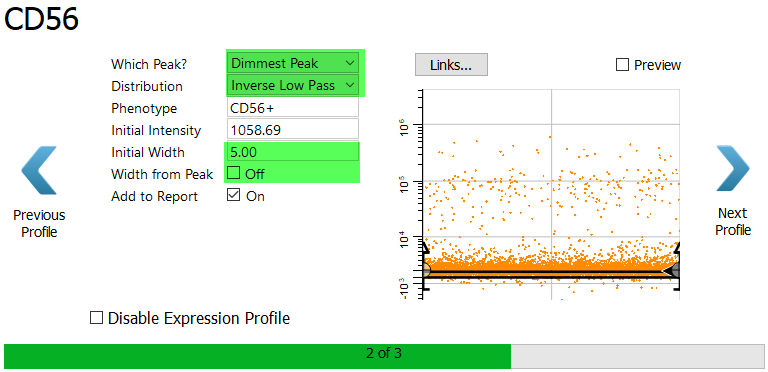
For CD56 we want the dim to bright events. The best way to capture them is with an Inverse Low Pass profile.
Choose Dimmest Peak and Inverse Low Pass.
Since the dim peak has a very small width, let's manually adjust the width so that we don't include the dimmest CD56 events.
Set the Initial Width to 5.0 and uncheck Width from Peak.
Enable the Preview checkbox to verify that the dim to bright events are selected.
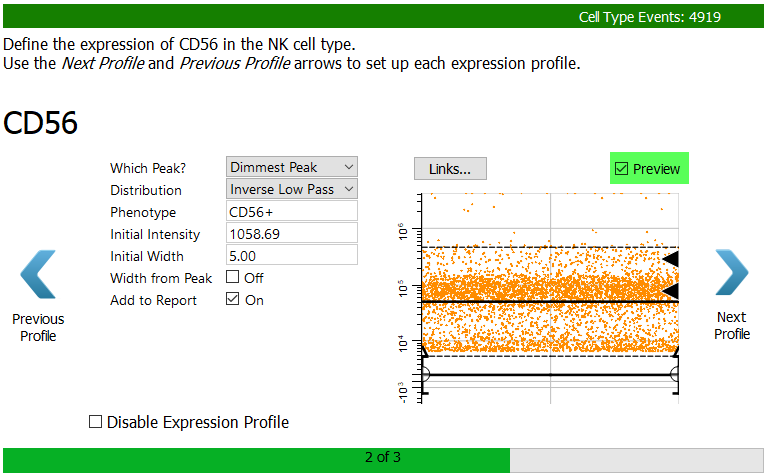
Click Next Profile.
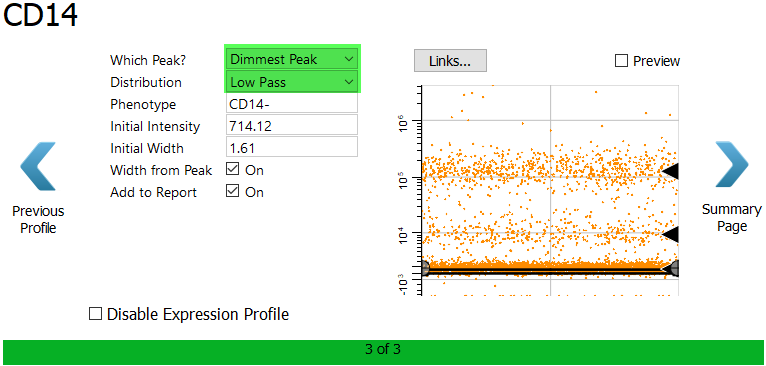
For CD14, choose Dimmest Peak and Low Pass.ac
Enable the Preview checkbox to verify the selection.
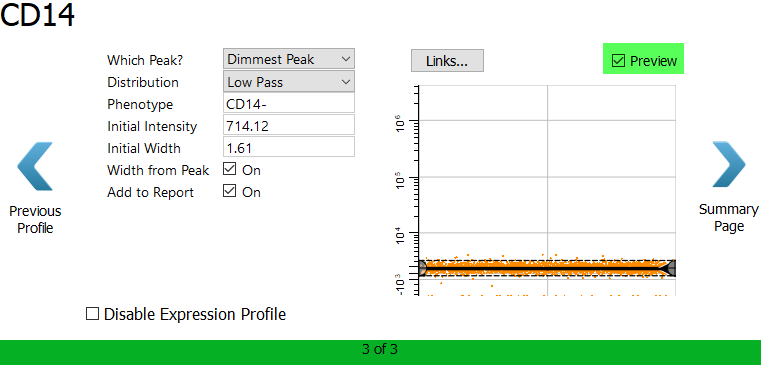
Click Summary Page.
Review the cell type wizard summary and click Finish.
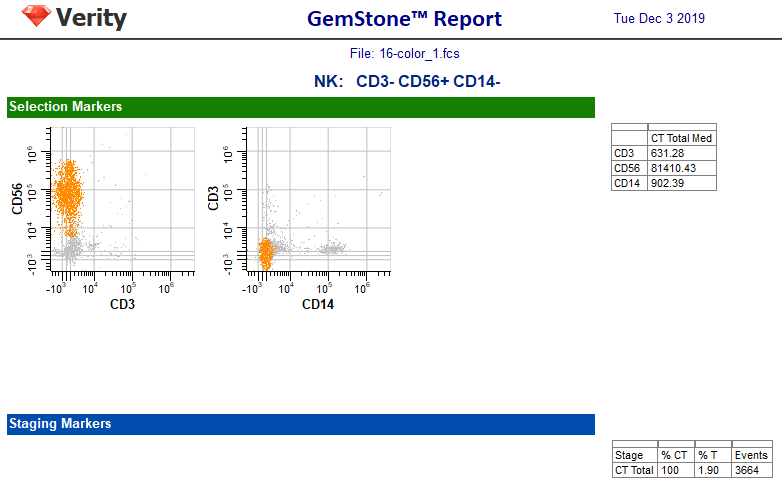
The report page for the NK cell type is very simple, with just the three selection markers.
The model template now has three cell types: CD4 T, CD8 T, and NK. Let's test it out by running the batch of FCS files in our training set. We'll review the reports for each of these to verify that all cell types are working properly.
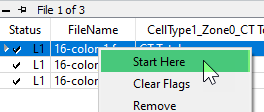
Right-click the first file in the batch list and choose Start Here.
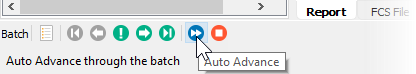
Click the Auto Advance button to automatically process all three files in the batch.
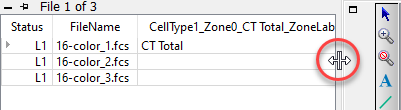
When the batch is finished, you can review the results by scrolling horizontally in the batch list, the part of the window where the files are listed. You can change the width of the batch list by adjusting the right edge as shown below. Result for all three cell types will appear in the database.
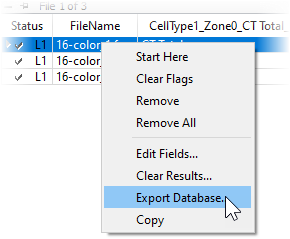
If you want to perform additional statistical analysis on the results in another program, you would right-click on the batch list and choose Export Database. This option displays a file save dialog and allows you to save the database in tab-delimited format, which can be imported into spreadsheets, word processors, and lab information systems.
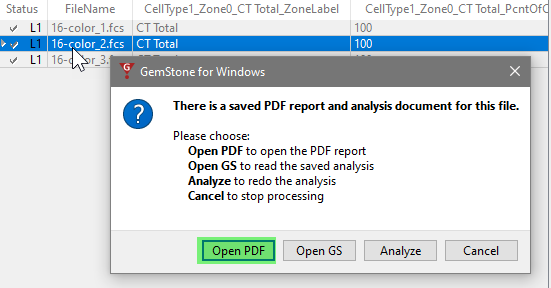
You can compare the report PDFs for each of the files. Double-click the file in the list. The program will ask what you want to do: open the PDF, open the saved analysis (Open GS), redo the analysis (Analyze), or cancel the dialog.
Choose Open PDF to view the report in PDF format. Note, at this point the first page in the report will be blank.
Repeat this for each of the files in the batch list.
In this tutorial you extended the model template by adding two more cell types: CD8 T and NK. You learned how to link expression profiles from one cell type to another. Linking profiles helps to speed up the processing and makes the model template more consistent and robust.
We introduced the use of Inverse Low Pass distributions for capturing the dim to bright distribution of the CD8 marker.
In the next tutorial you will learn how to analyze subsets in a cell type.