This tutorial will introduce you to some of the key features of ModFit LT, including creating a new project, adding files to it, and setting up the processing options for Auto Analysis.
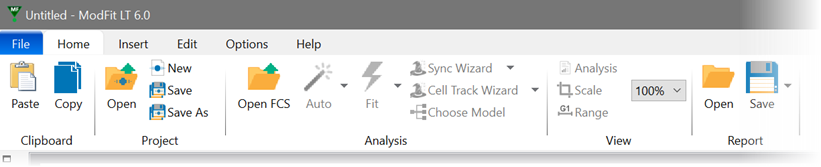
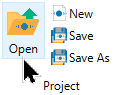
The ModFit LT ribbon bar appears at the top of the application window. Buttons are grouped to give you quick access to the most common commands in ModFit LT.
Create a new project
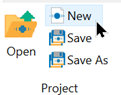
We start by creating a new project.
The New Project dialog is displayed.
Choose Cell Cycle for the Type.
For the Name, enter Tutorial 1.
Click the More button and enable the Copy Data Files option.
Click OK
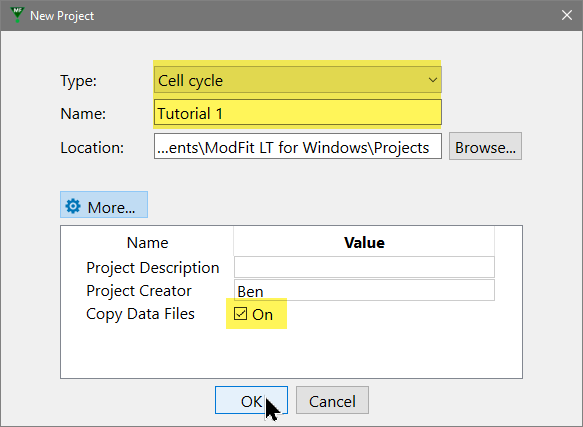
ModFit LT will create a folder in your Documents ModFit LT Projects folder named Tutorial 1. When we select FCS files for this project, ModFit LT will copy the files into the project folders.
What is a project?
A project
in ModFit LT is a folder on disk used to organize an analysis or experiment.
It keeps track of the kind of analysis you're doing, the files you
analyze, the output of the analysis, and even a database of analysis results.
For more on projects, see Projects
in ModFit LT.
Add files to the project
With our Cell Cycle project created, let's add some FCS files.
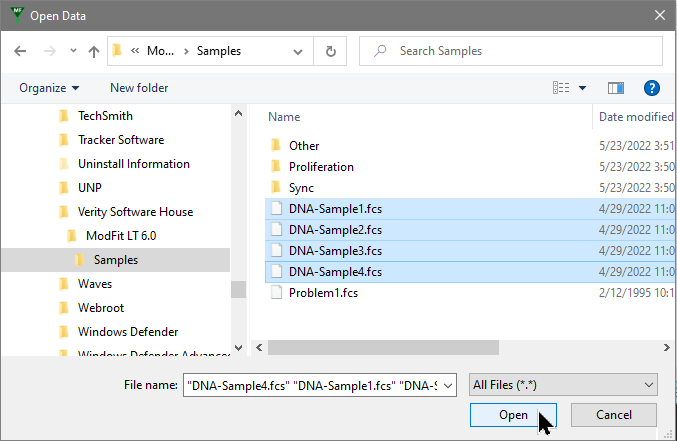
The files will be added to the file list for the project, and the first file will be opened.
Select the measurement to analyze and setup a gate
When the first file is opened, the Analysis Setup dialog is displayed. This dialog allows us to set up one or more gates and to select the measurement that we want to analyze.
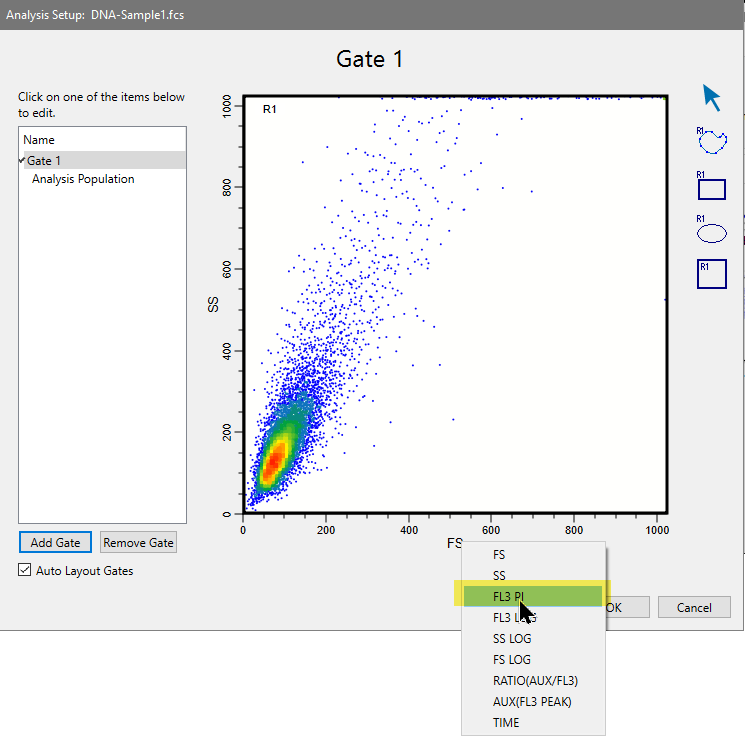
The measurement that we want to analyze is already correctly selected: FL3 PI.
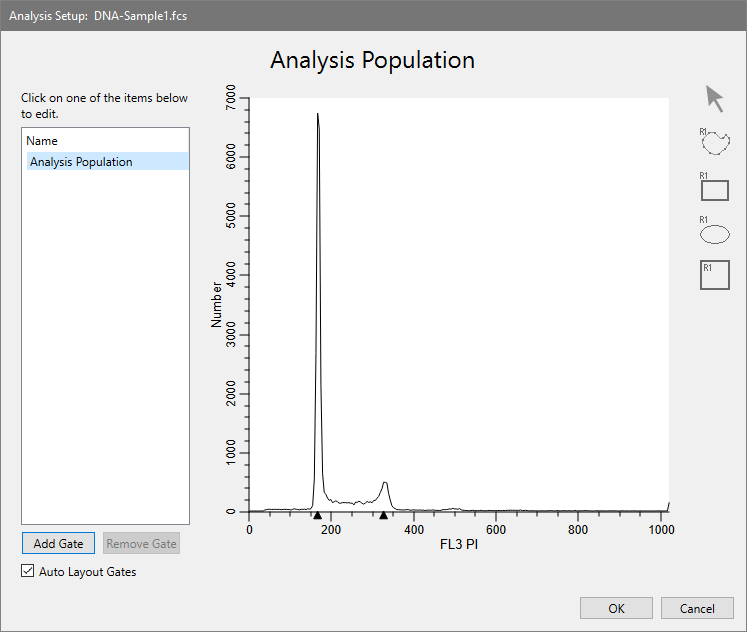
Let's add a gate so that we can better visualize the data.
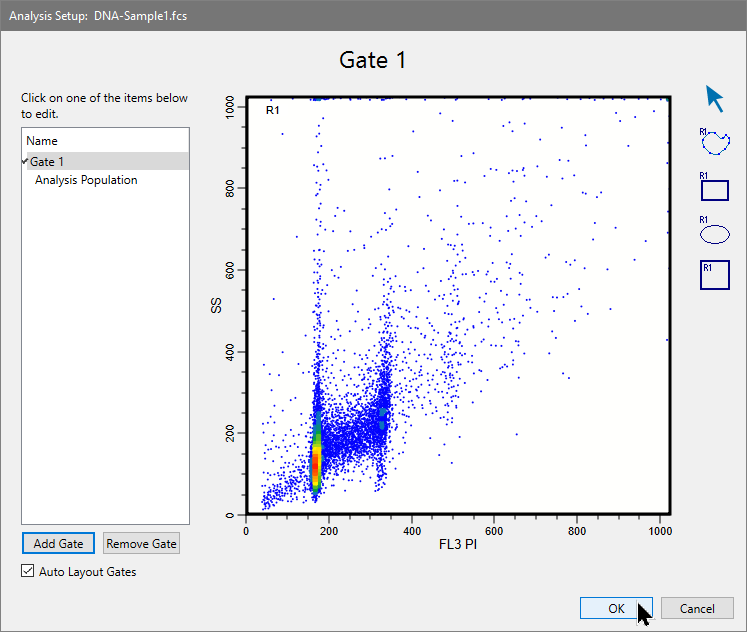
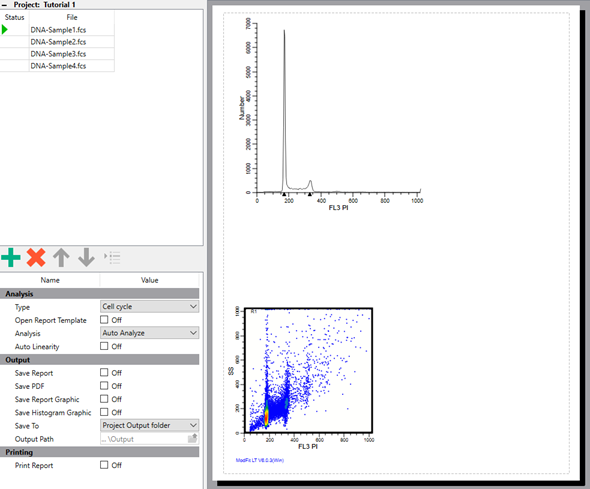
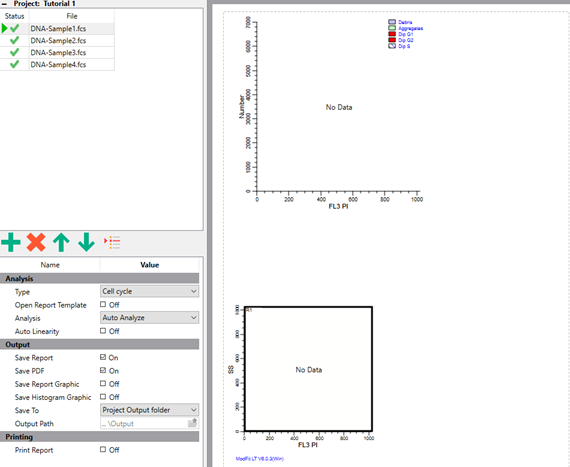
The dialog closes and the file is read. The report page shows a 1P histogram of the DNA measurement "FL3 PI", as well as a gate plot of FL3 PI vs SS. On the left of the main window, the FCS files appear in a list. Below the list of files, processing options are shown.
Choose processing options
The processing options in the lower-left portion of the screen determine what actions ModFit LT will perform when it analyzes each of the FCS files we added to the list. The Type is already set to Cell cycle; we chose that when we created the project. The Analysis is set to Auto Analyze, and that's what we want for this project. Let's enable two output options.
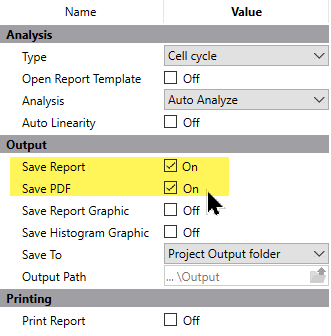
With these settings, each file will be Auto Analyzed, a report will be saved, and a PDF will be created.
Other options
For details about each of the processing options, take a look at Batch Processing.
Processing the files
We are ready to analyze the files in this project. This is done using the controls at the very bottom-left of the main window.
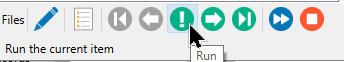
Batch toolbar
The batch toolbar has controls to move through the list of files in your project one at a time, or automatically to the end of the list.
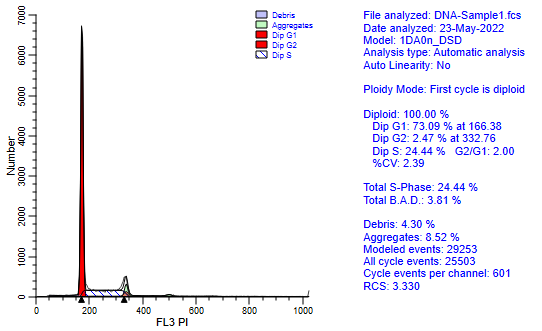
ModFit performs its automatic analysis of the sample. It scans the histogram for peaks, and based on the sizes and positions, ModFit LT determines the number of cell-cycles in the sample. It performs a non-linear least squares analysis of the data. The results of the analysis are shown to the right of the DNA histogram.
We can process the rest of the files in the list automatically.
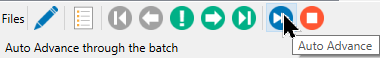
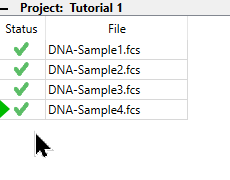
Processing the remaining files will not take long. Notice that the file list indicates that a file has been analyzed as each one is processed.
Create a database
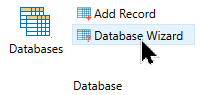
Let's use the Database Wizard to set up a database of the analysis results for the project.
The Database Wizard dialog is displayed.
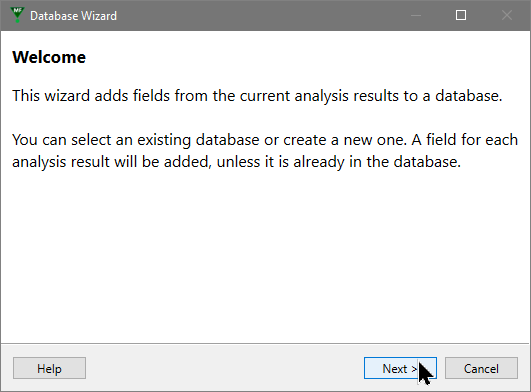
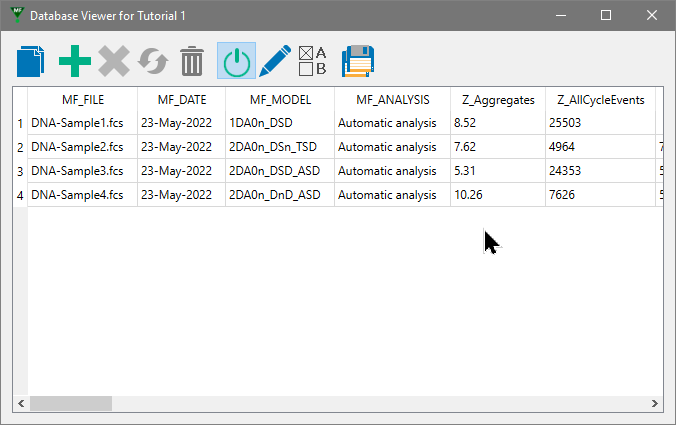
When the wizard closes, a new Database Viewer window appears on the screen. This window will allow us to view records as they are added to the database. The fields in the database were added by the wizard, based on the analysis we performed.
Since it was so quick to analyze the files in our project, let's analyze them again so that the results can be added to the database we just created.
The Database Viewer window fills with four records of analysis from the four files.
Project database
When a new project is created, a database is created for it. Use the Database Wizard to add fields quickly to the project's database. You can show or hide the viewer without affecting the database, and records will be added as files are analyzed as long as the database is "active". A button on the Database Viewer toggles the active state of the database on or off.
Optional step
Creating a database is an optional step for a project. It is a useful step if you want to export your experimental results to another program, such as Excel, for further analysis.
Review the analysis
At this point, we have a working database and we should also have a PDF and report for each of the FCS files in our project. Let's take a look at a report and PDF.
The analysis report for the first file is opened and we can review or modify the analysis.
The PDF for this analysis will open in your computer's default PDF viewer. It will match the report in the ModFit LT window.
Reports can also be opened using the Open Report button on the Home tab of the ribbon.
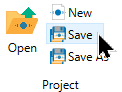
Re-save the project
It's always a good idea to use the Save Project button after making changes to the project. This is done automatically for some changes you make, but not for all.
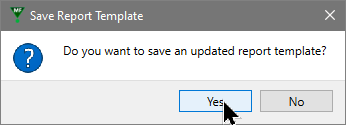
Report template
The report template contains information about the
measurement selected for analysis, the gate, and any other elements you
might add to the report. The template is opened whenever you reopen
the project.
Reopen the project
Let's reopen the project to verify that it saved correctly.
The project will open. The list of files and the processing options should be the same as we left them. The database viewer is shown. The report template is loaded, but it will show No Data in the DNA and gate plots.
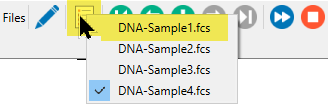
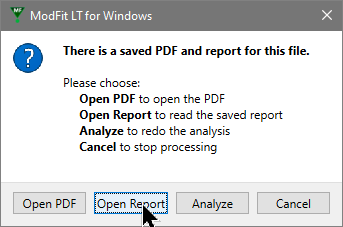
To review one of the reports already analyzed, double-click the file in the list and choose Open Report. You can add files to the project to analyze more. You can also save the project under another name and it will be set up just like this project.
Welcome to ModFit LT!