In this tutorial, you will learn how to extract information about subsets within a cell type. We use the term "subset" to refer to a group of cells within a cell type that have some common attributes, but they do not necessarily fall into a particular stage of development.
A good example of a subset is the Treg subset of CD4 T cells. These cells are positive for CD25, negative for CD127, and they can occur in any stage of CD4 T cells.
In this tutorial you will add to the Project we developed in the previous tutorials, Starting a New Project from Scratch and Adding Cell Types to the Project. You will add a TriCOM object to quantify cells that are CD25+CD127- and add a table to the report to show Treg statistics.
This tutorial continues to build the Project that was started in the following tutorials:
Develop: Starting a New Project from Scratch
Develop: Adding Cell Types to the Project
Start Gemstone by following the instructions in the Installation and Setup of GemStone section.
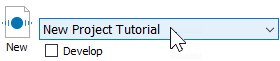
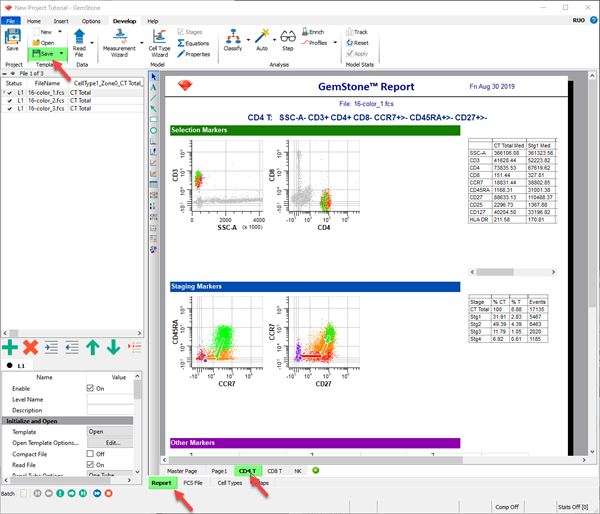
Open the "New Project Tutorial" Project that you created in the previous tutorials by selecting it in the Project dropdown list.
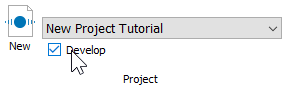
Click the Develop checkbox to enable develop mode.
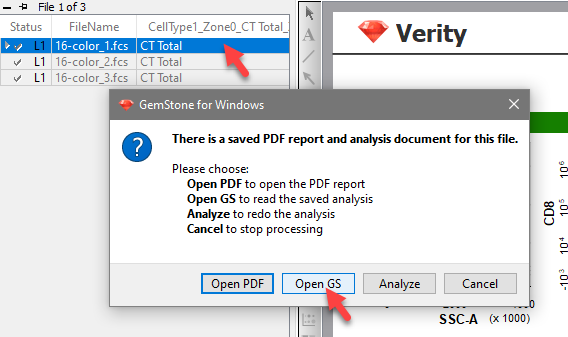
Double-click the first file in the batch list. A dialog of choices will be displayed.
Click Open GS to open the saved analysis for the file.
Next we need to make several edits with the Cell Type wizard. These edits will allow us to define the Treg subset of CD4 T cells.
Click the Cell Type Wizard button to initiate the wizard.

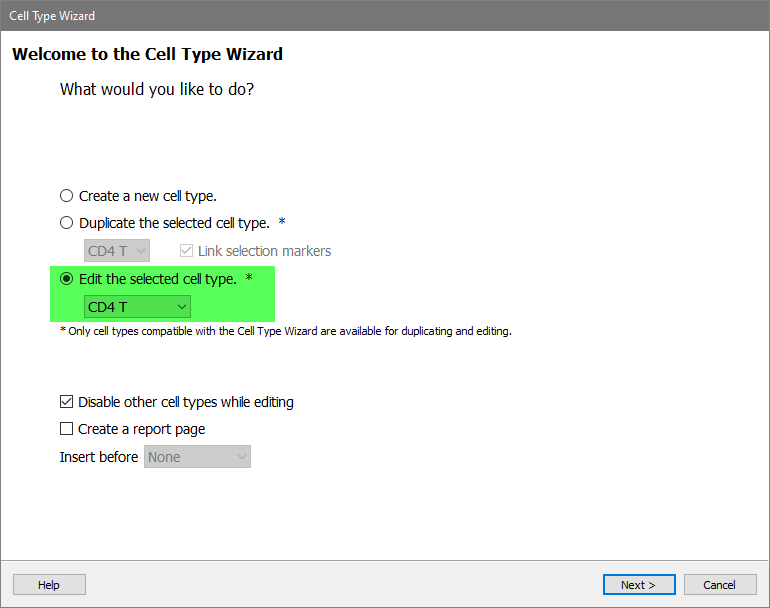
This time you will use the wizard to edit the CD4 T cell type.
Click the Edit the selected cell type option and select CD4 T from the list of choices and click Next.
We only need to edit the Functional markers, so we can skip past a number of pages in the wizard:
Click Next on the Cell Type Properties page.
Click Next on the Selection Markers page.
Click Next on the Staging Markers page.
Click Next on the Functional Markers page.
Most of the expression profiles do not need any edits:
Click Next Profile on the Profiles pages for SSC-A, CD3, CD4, CD8, CCR7, CD45RA, and CD27.
For CD25, set up the expression profile with the following:
Choose Constant for the shape and Dimmest Peak for the peak.
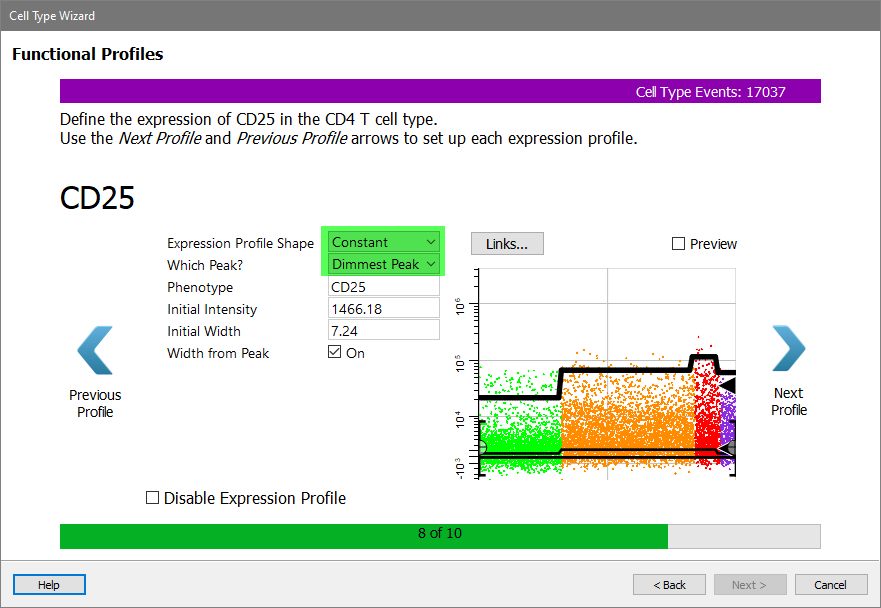
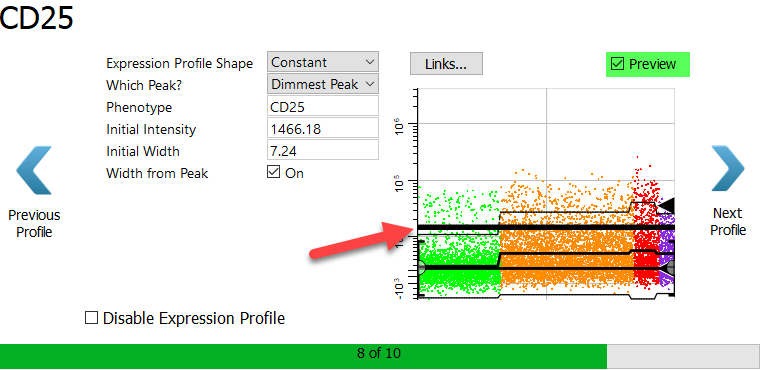
Enable the Preview checkbox to try out these settings.
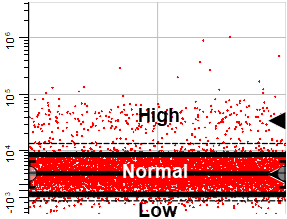
Note the heavy black line above the expression profile. These identify the 95% confidence limits of the profile. Events that are above the top line have a low probability of being included in the profile. They are the events that will be considered "high" for CD25 as we define the Treg events.
If you wanted to include fewer events in the profile, you would make the Initial Width smaller and uncheck Width from Peak. Similarly, to include more events, you would make the Initial Width larger.
Click Next Profile.
For CD127, set up the expression profile with the following:
Choose Constant for the shape and Brightest Peak for the peak.
Set the Initial Width to 8.0 and uncheck the Width from Peak option.
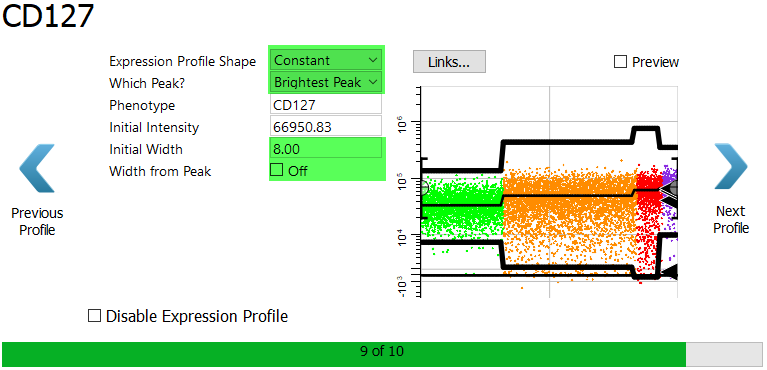
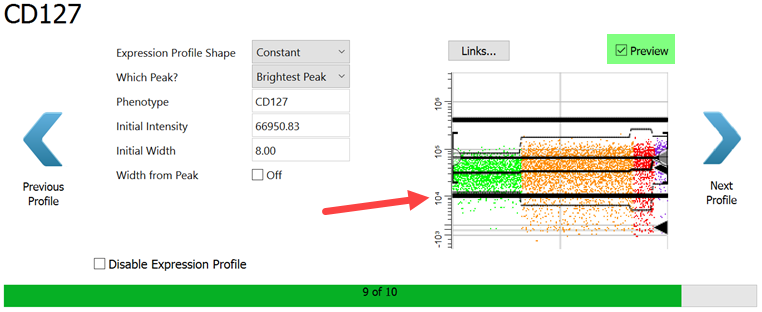
Enable the Preview checkbox.
The Initial Width of 8 puts the lower side of the 95% confidence limit in a good position to separate positives and negatives. Events within the confidence boundaries will be considered "positive" for CD127, and those that fall below the lower boundary will be considered "negative" for CD127.
Click Next Profile.
Skip over the HLA DR profile for the time being. Click Summary Page.
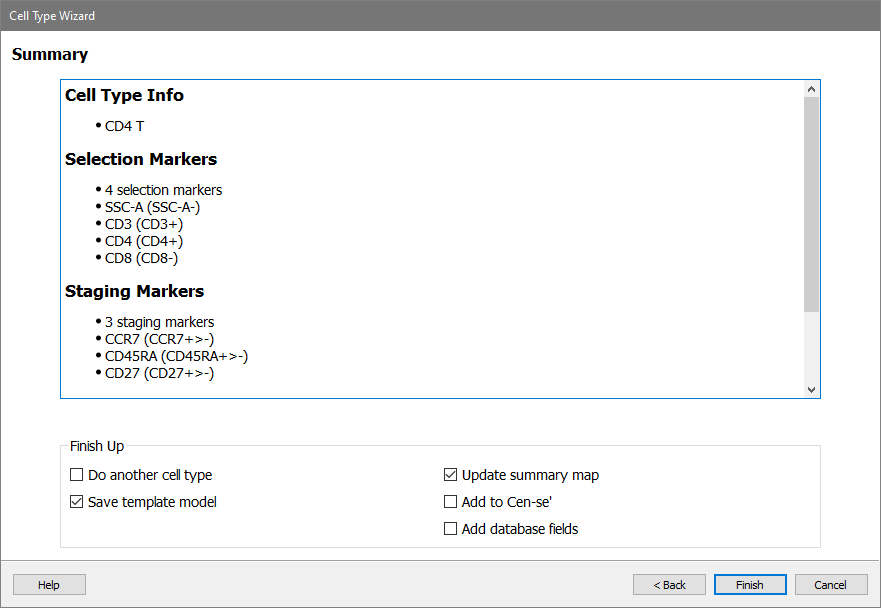
Review the summary information. Make sure that Save template model and Update summary map options are checked.
Click Finish to close the wizard and save your changes.
TriCOM is the tool that can identify subsets within a cell type. As its name implies, TriCOM can compute three states for the combination of measurements that we add to it. The three stats identify whether an event is within the 95% confidence limits of the expression profile (normal), below the lower confidence limit (low), or above the upper confidence limit (high).
In some cases, you may only be interested in whether the expression is high, as with CD25 in this tutorial. In other cases, only the low expression is of interest. TriCOMs can be set up for High-Only and Low-Only to accommodate these cases.
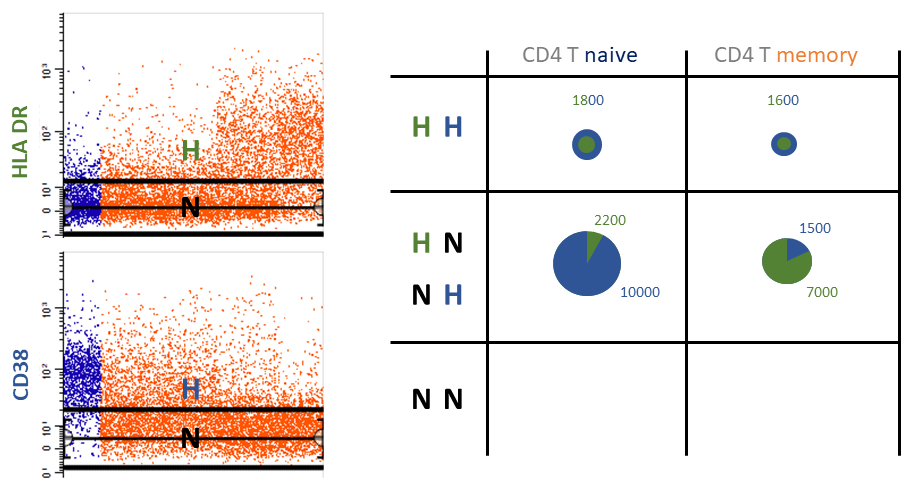
Here is an example that uses a High-Only TriCOM to quantify activated CD4 T cells. In the illustration, there are two expression profiles on the left, one for HLA DR and the other for CD38. These are activation markers for CD4 T cells. The plots show the high (H) and normal (N) expression levels. Also note that there are two stages: naive CD4 T cells are dark blue dots and memory cells are orange dots. A cartoon of a TriCOM is shown on the right. The bottom row of the TriCOM would show events that are in the normal 95% confidence limits, however this TriCOM is set up to show high events only. The next row up from the bottom quantifies events that are high for either HLA DR or CD38, but not both. For example, there are 2200 events that are high for HLA DR in the naive stage and 7000 events high for HLA DR in the memory stage. The top row contains events that are high for both HLA DR and CD38.
Let's create a TriCOM to see how it works.
On the Insert tab of the ribbon, click the TriCOM button. There is also a TriCOM button on the cell type toolbar on the left edge of the Cell Type window.
Scroll to find an empty place on the CD4 cell type, then click and drag to define the TriCOM location. A TriCOM with default measurements is created.
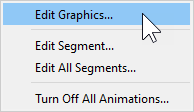
Right-click in the TriCOM and choose Edit Graphics from the context menu.
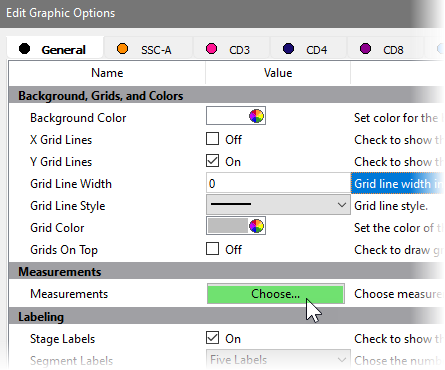
Find the Measurements section of the dialog and click the Choose button.
Uncheck the SSC-A, CD3, and CD4 measurements Include property.
Check the CD25 and CD127 Include property.
Select High Only for CD25 and select Low Only for CD127.
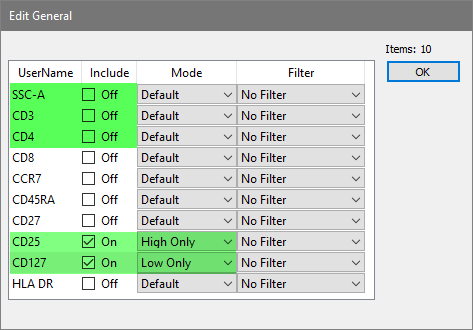
Click OK.
Click OK to close the Edit Graphic Options dialog.
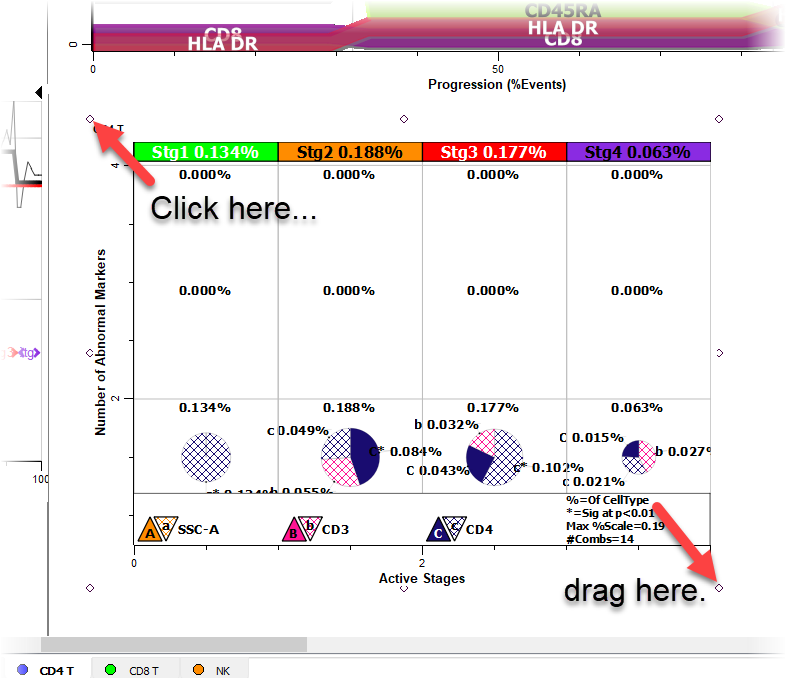
The TriCOM for CD25 and CD127 is displayed.
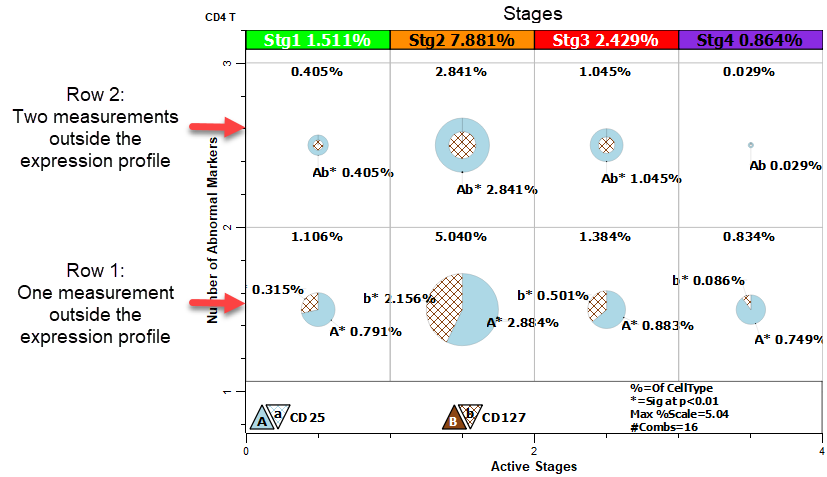
The TriCOM is divided into four vertical sections, one for each of the stages. The Y-axis shows the number of measurements that are outside the expression profiles. Each element in row one has one measurement outside the expected expression level, while row two has two measurements outside the expression profile. The key at the bottom indicates that A is CD25 and B is CD127. An uppercase letter indicates elevated expression, and a lowercase letter indicates low expression.
Notice the largest pie on the bottom row. All of the cells in this pie are in the Stg2 stage of the progression. The A wedge represents cells that have elevated CD25 and normal, positive expression of CD127. The b wedge represents cells that have low expression of CD127 and normal, low expression of CD25.
Pies on the second row have the phenotype Ab, which corresponds to CD25+ CD127-. This is Treg phenotype. The size of the pies is proportional to percentage, so Stg2 contains the largest fraction of the Tregs.
Even though we will not rename the stages in this tutorial, it is useful to know that GemStone allows you to rename stages from the default stage names of Stg1, Stg2, etc. The Stages command on the Develop tab is used for this purpose. Some of the elements on reports need to be updated after stages are renamed, and the easiest way to update them is to use the Cell Type Wizard to edit the cell type and create a new report page.
We will leave that for another tutorial.
We can use animation to verify the Treg events. Animation will blink events in all of the plots for the pie segment that we select.
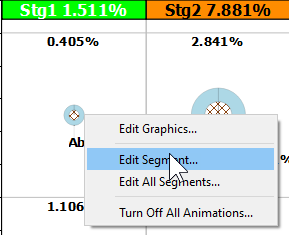
Right-click the pie for Ab events in the Stg1 stage and choose Edit Segment.
Note: your statistics may differ from those shown in the images below.
In the Animation section, choose a bright color like pink and enable the Animate checkbox. Scroll the cell type window with this dialog open. Open the CD25 and CD127 profiles. Note the events blinking in the expression profile plots are CD25+ CD127- in Stg1.
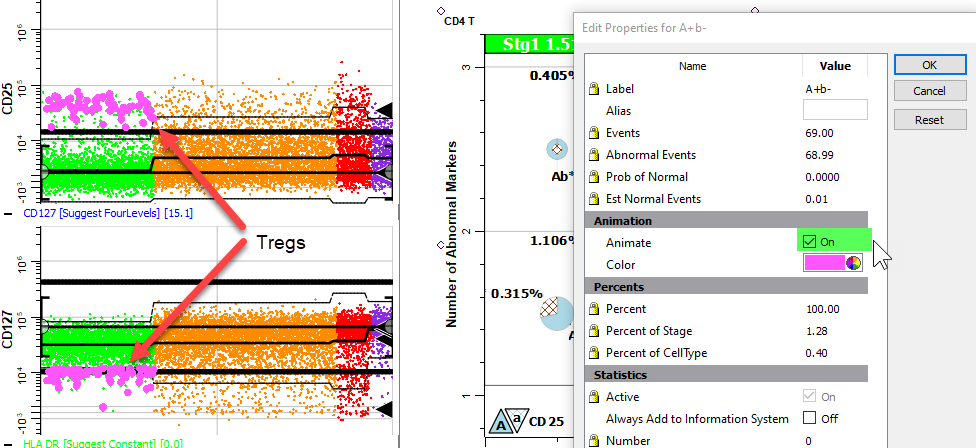
Uncheck the Animate checkbox and click OK to close the dialog.
Right-click the large Ab pie on the upper row in Stg2 and choose Edit Segment.
Choose a bright color and enable the Animate checkbox.
Again the CD25+ CD127- events are blinking, this time in Stg2.
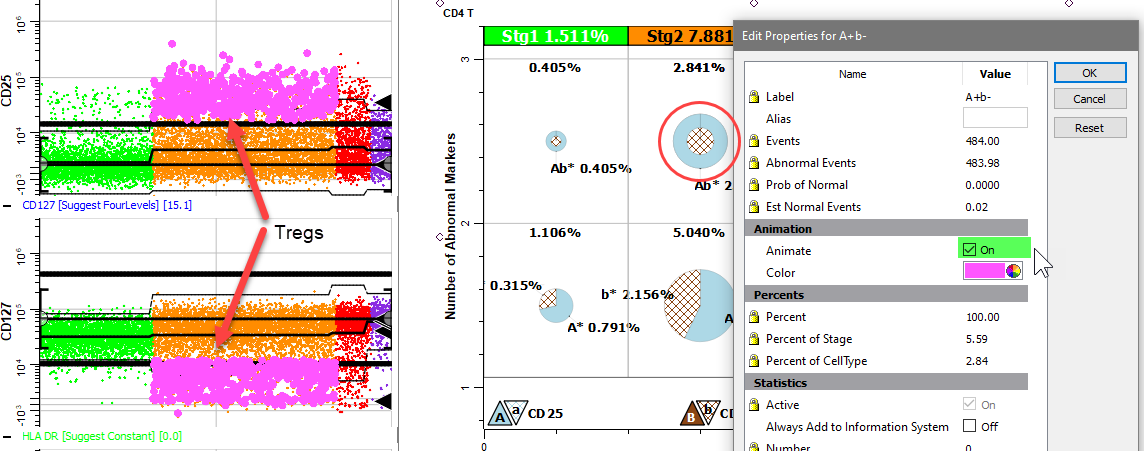
Animation makes it easy to verify the TriCOM segments.
Uncheck the Animate checkbox and click OK to close the dialog.
Let's create a table under the TriCOM to show the percentages for the Tregs in each stage, as well as the total percentage of Tregs.
Click the Table tool on the Cell Type toolbar or on the Insert tab of the ribbon.

Below the TriCOM you just created, click and drag to define space for a table.
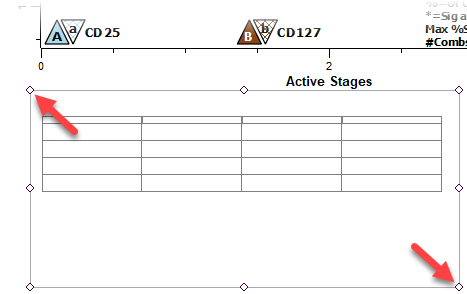
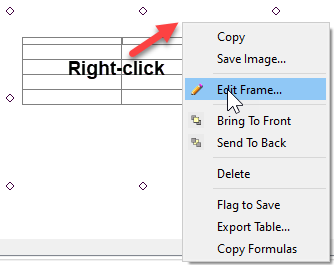
Right-click just above the table's grid and choose Edit Frame in the menu.
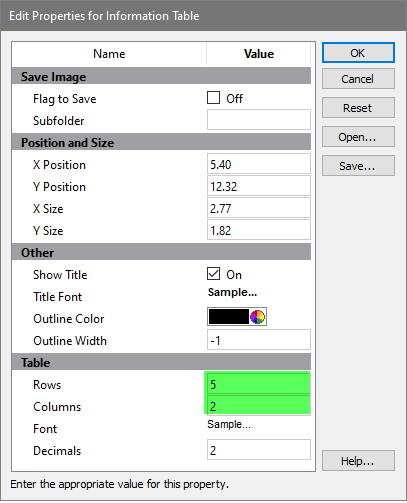
Edit the Rows to 5 and Columns to 2.
Click OK.
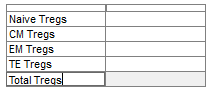
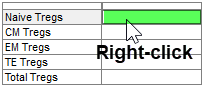
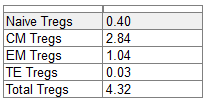
In the first column, type the following text labels:
Naive Tregs, CM Tregs, EM Tregs, TE Tregs, and Total Tregs.
Next you will add information fields that contain the percentages for the Treg subset.
Left-click the cell next to Naive Tregs, then right-click that cell.
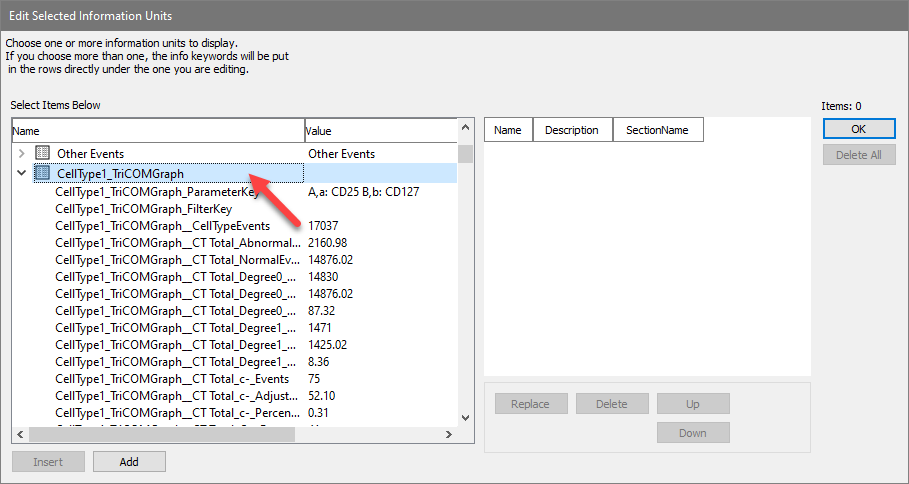
The Edit Selected Information Units dialog is displayed. This dialog contains all of the information that GemStone has computed for this model template and FCS file, including the TriCOM information.
Note, you may need to resize this dialog and adjust column widths on some monitors to see the information presented below.
Scroll to the section labelled CellType1_TriCOMGraph and click the arrow next to the label to open the section.
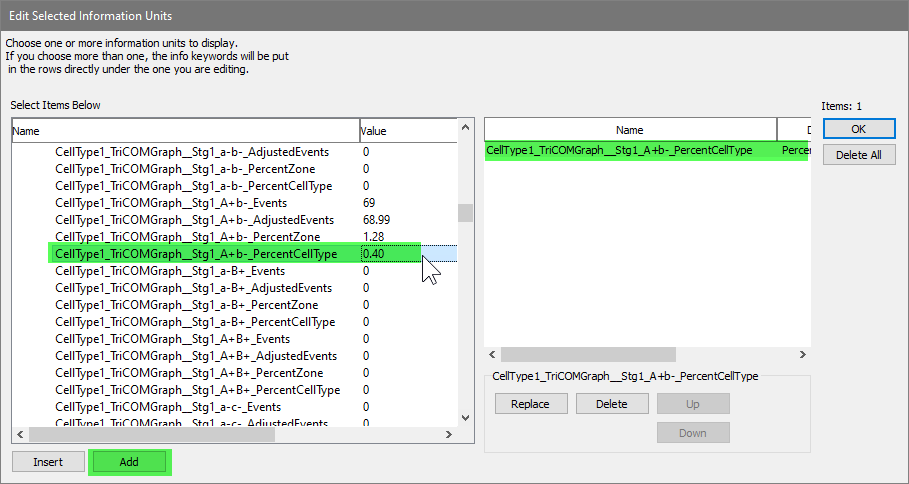
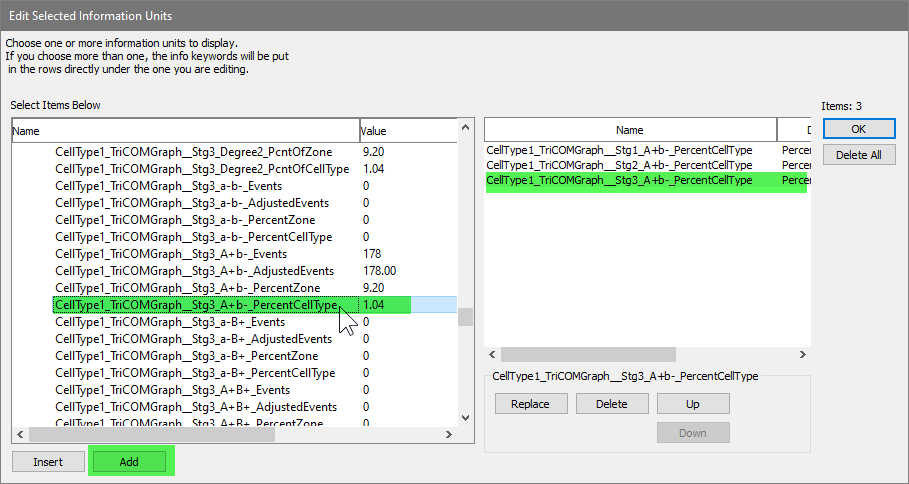
Select the item named CellType1_TriCOMGraph_Stg1_A+b-_PercentCellType and click the Add button. The statistic is added to the list on the left of the dialog.
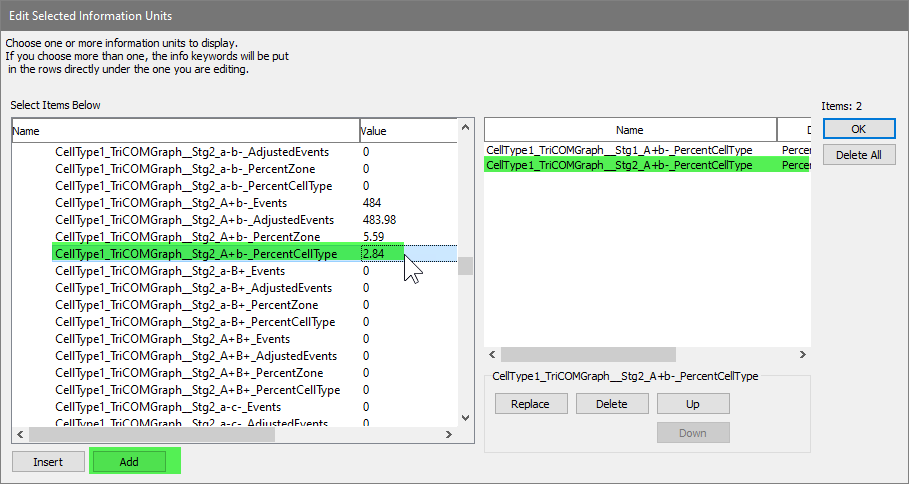
Scroll down in the list and select CellType1_TriCOMGraph_Stg2_A+b-_PercentCellType. Click Add to add it to the list on the left.
Next select CellType1_TriCOMGraph_Stg3_A+b-_PercentCellType and click Add.
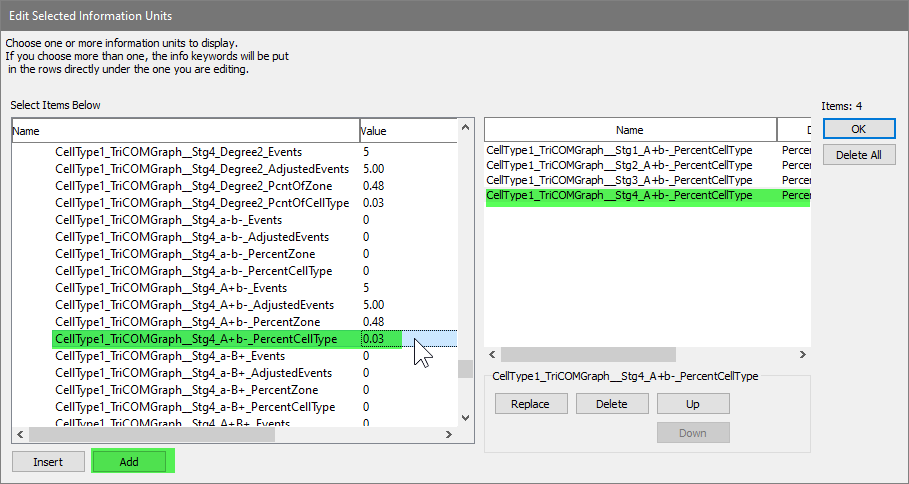
Select CellType1_TriCOMGraph_Stg4_A+b-_PercentCellType and click Add.
Scroll back up to the CT total section and add the CellType1_TriCOMGraph_CTTotal_A+b-_PercentCellType.
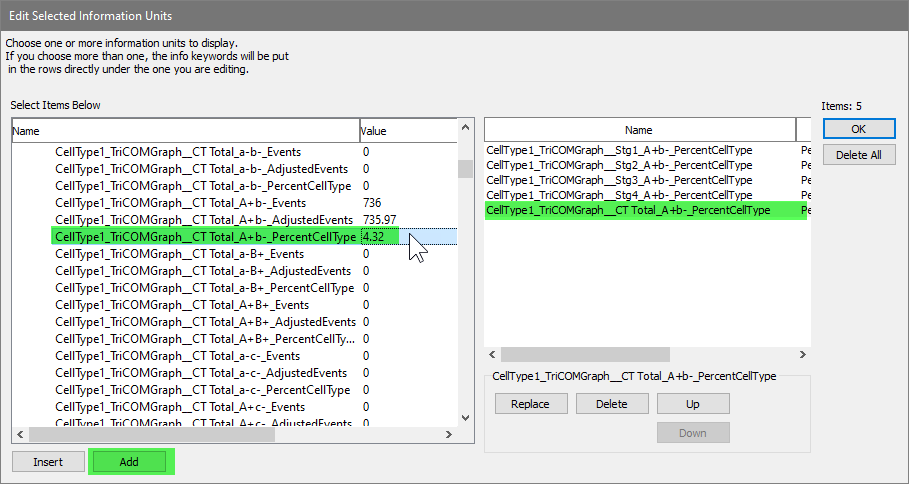
With these five statistics added to the list on the left, click OK.
The fields we picked fill down from the selected cell, and the five results are added to the table. You may need to tab out of the first cell to see the value.
You can create tables on a report page using the same technique.
At this point you have a TriCOM for Tregs in the CD4 T cell type and a table to display the results. This is the approach used to quantify subsets within a cell type.
Before saving, switch back to the Report tab, display the CD4 T report page, and scroll it to the position you want to appear when this template is used. The template will remember this view when it is saved. Click Save in the Template section of the ribbon.
This tutorial introduced the TriCOM object, which you used to identify the Tregs subset of CD4 T cells. TriCOMs are associated with functional markers and identify elevated and diminished levels of expression. The Tregs TriCOM quantified high CD25 and low CD127 expression.
You animated segments of the TriCOM to see where the associated events appear in other plots. This technique was used to verify that the TriCOM was working correctly.
Once the TriCOM was created you created a table, added some text labels to it, and then selected the results to display in the table.
The next tutorial introduces the Cen-se' plot and how it is used to explore your data.